29
/
en
AIzaSyAYiBZKx7MnpbEhh9jyipgxe19OcubqV5w
April 1, 2024
76927
Bahrain
BHR
true
2
1
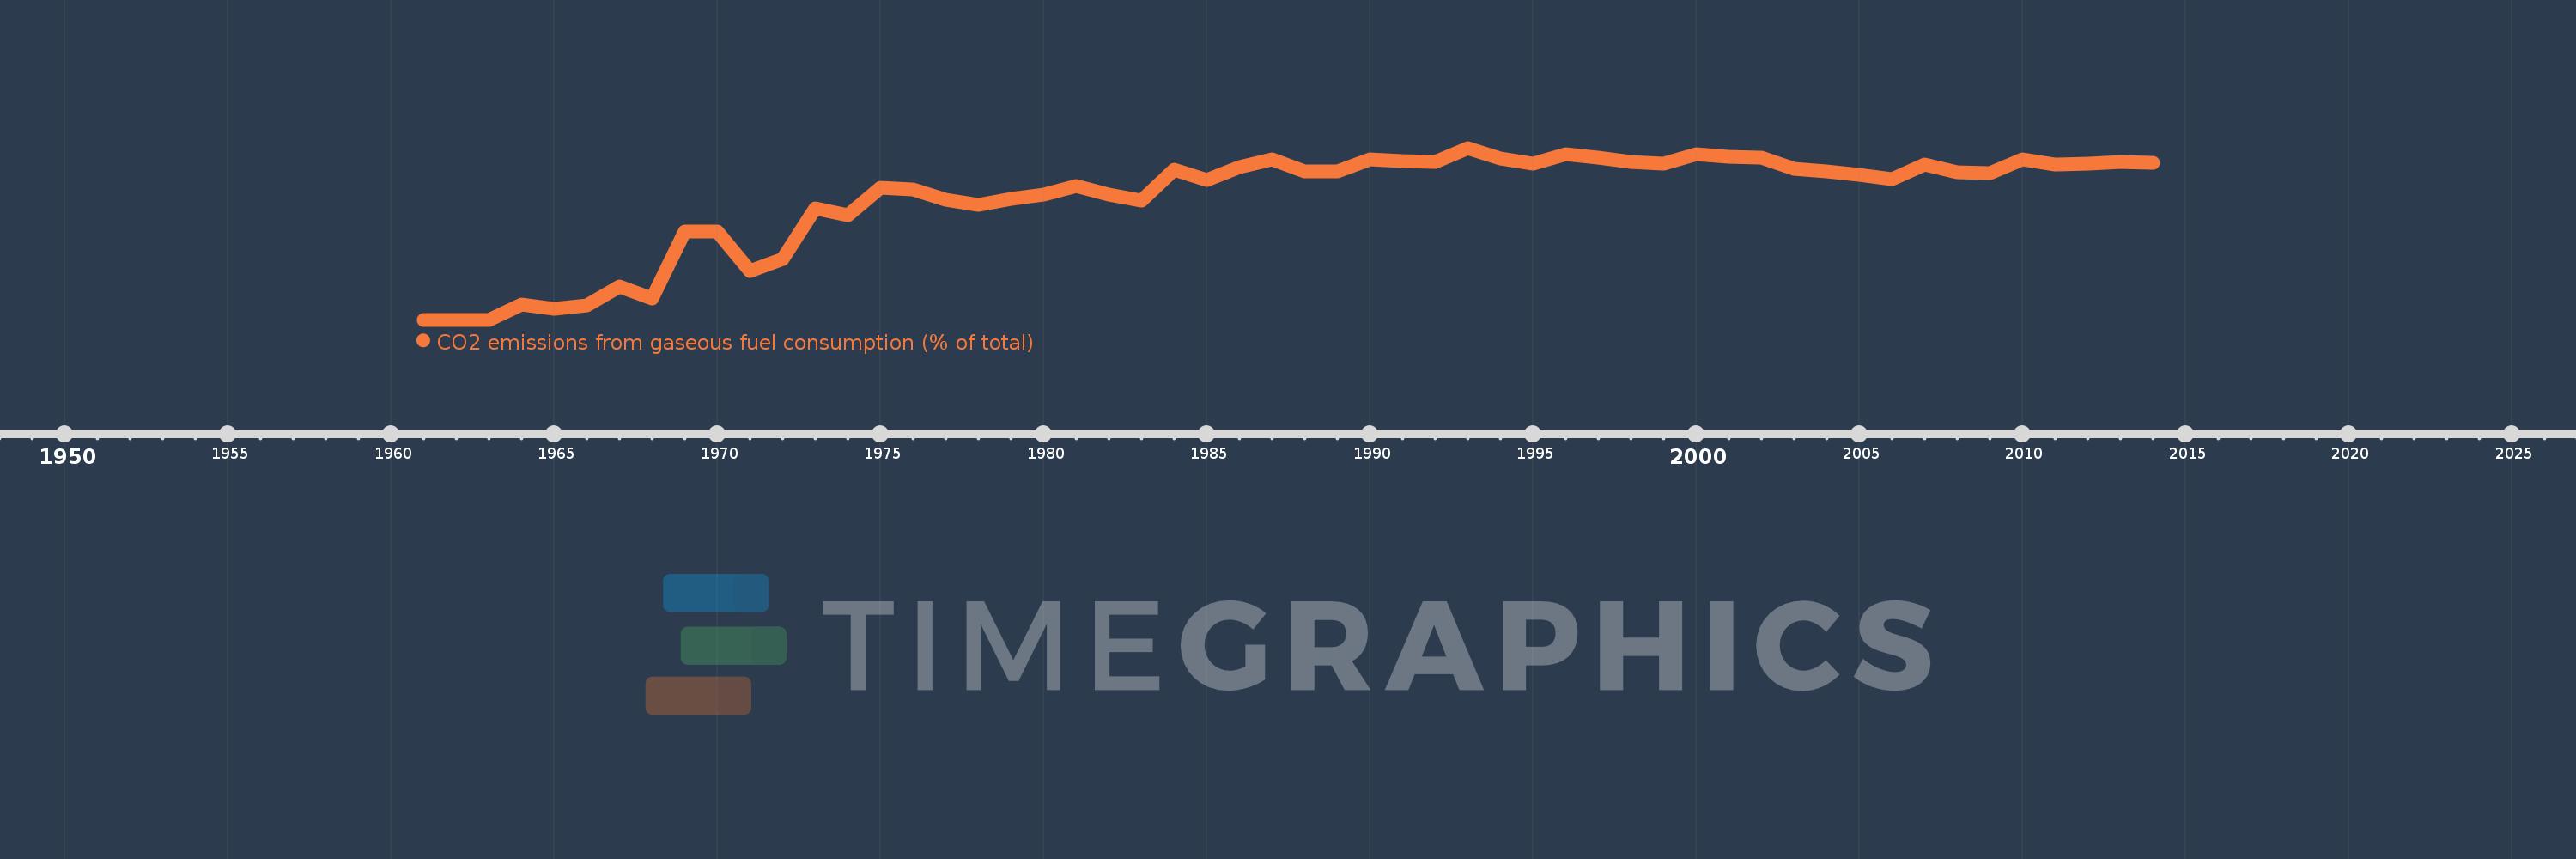
CO2 emissions from gaseous fuel consumption (% of total)
2014,2013,2012,2011,2010,2009,2008,2007,2006,2005,2004,2003,2002,2001,2000,1999,1998,1997,1996,1995,1994,1993,1992,1991,1990,1989,1988,1987,1986,1985,1984,1983,1982,1981,1980,1979,1978,1977,1976,1975,1974,1973,1972,1971,1970,1969,1968,1967,1966,1965,1964,1963,1962,1961
This statistics in other country:
AfghanistanAlbaniaAlgeriaAndorraAngolaAntigua and BarbudaArab WorldArgentinaArmeniaArubaAustraliaAustriaAzerbaijanBahamas, TheBahrainBangladeshBarbadosBelarusBelgiumBelizeBeninBermudaBhutanBoliviaBosnia and HerzegovinaBotswanaBrazilBritish Virgin IslandsBrunei DarussalamBulgariaBurkina FasoBurundiCabo VerdeCambodiaCameroonCanadaCaribbean small statesCayman IslandsCentral African RepublicCentral Europe and the BalticsChadChileChinaColombiaComorosCongo, Dem. Rep.Congo, Rep.Costa RicaCote d'IvoireCroatiaCubaCuracaoCyprusCzech RepublicDenmarkDjiboutiDominicaDominican RepublicEarly-demographic dividendEast Asia & PacificEast Asia & Pacific (excluding high income)East Asia & Pacific (IDA & IBRD countries)EcuadorEgypt, Arab Rep.El SalvadorEquatorial GuineaEritreaEstoniaEthiopiaEuro areaEurope & Central AsiaEurope & Central Asia (excluding high income)Europe & Central Asia (IDA & IBRD countries)European UnionFaroe IslandsFijiFinlandFragile and conflict affected situationsFranceFrench PolynesiaGabonGambia, TheGeorgiaGermanyGhanaGibraltarGreeceGreenlandGrenadaGuatemalaGuineaGuinea-BissauGuyanaHaitiHeavily indebted poor countries (HIPC)High incomeHondurasHong Kong SAR, ChinaHungaryIBRD onlyIcelandIDA & IBRD totalIDA blendIDA onlyIDA totalIndiaIndonesiaIran, Islamic Rep.IraqIrelandIsraelItalyJamaicaJapanJordanKazakhstanKenyaKiribatiKorea, Dem. People’s Rep.Korea, Rep.KuwaitKyrgyz RepublicLao PDRLate-demographic dividendLatin America & Caribbean Latin America & Caribbean (excluding high income)Latin America & the Caribbean (IDA & IBRD countries)LatviaLeast developed countries: UN classificationLebanonLesothoLiberiaLibyaLiechtensteinLithuaniaLow & middle incomeLow incomeLower middle incomeLuxembourgMacao SAR, ChinaMacedonia, FYRMadagascarMalawiMalaysiaMaldivesMaliMaltaMarshall IslandsMauritaniaMauritiusMexicoMicronesia, Fed. Sts.Middle East & North AfricaMiddle East & North Africa (excluding high income)Middle East & North Africa (IDA & IBRD countries)Middle incomeMoldovaMongoliaMontenegroMoroccoMozambiqueMyanmarNamibiaNauruNepalNetherlandsNew CaledoniaNew ZealandNicaraguaNigerNigeriaNorth AmericaNorwayOECD membersOmanOther small statesPacific island small statesPakistanPalauPanamaPapua New GuineaParaguayPeruPhilippinesPolandPortugalPost-demographic dividendPre-demographic dividendQatarRomaniaRussian FederationRwandaSamoaSao Tome and PrincipeSaudi ArabiaSenegalSerbiaSeychellesSierra LeoneSingaporeSint Maarten (Dutch part)Slovak RepublicSloveniaSmall statesSolomon IslandsSomaliaSouth AfricaSouth AsiaSouth Asia (IDA & IBRD)South SudanSpainSri LankaSt. Kitts and NevisSt. LuciaSt. Vincent and the GrenadinesSub-Saharan Africa Sub-Saharan Africa (excluding high income)Sub-Saharan Africa (IDA & IBRD countries)SudanSurinameSwazilandSwedenSwitzerlandSyrian Arab RepublicTajikistanTanzaniaThailandTimor-LesteTogoTongaTrinidad and TobagoTunisiaTurkeyTurkmenistanTurks and Caicos IslandsUgandaUkraineUnited Arab EmiratesUnited KingdomUnited StatesUpper middle incomeUruguayUzbekistanVanuatuVenezuela, RBVietnamWest Bank and GazaWorldYemen, Rep.ZambiaZimbabwe Timeline:
This timeline shows a graph from 1961 to 2014 of Bahrain. No data until 1960. Number of actual observations by date: 54.
Source name:
World Development Indicators
Source organization:
Carbon Dioxide Information Analysis Center, Environmental Sciences Division, Oak Ridge National Laboratory, Tennessee, United States.
Categories, topics:
Energy & Mining, Climate Change, Environment
Last updated:
apr 23, 2017
Indicators value changes by year
Maximum:
91.221
jan 1, 1993
At the date of observation
Value
Absolute change
Change from previous value
jan 1, 1964
7.975
+7.975
%
jan 1, 1965
5.963
-2.012
-25.23%
jan 1, 1966
7.761
+1.798
30.15%
jan 1, 1967
17.514
+9.753
125.66%
jan 1, 1968
11.314
-6.2
-35.4%
jan 1, 1969
46.844
+35.53
314.04%
jan 1, 1970
46.686
-0.158
-0.34%
jan 1, 1971
25.884
-20.802
-44.56%
jan 1, 1972
32.207
+6.323
24.43%
jan 1, 1973
58.964
+26.757
83.08%
jan 1, 1974
55.71
-3.254
-5.52%
jan 1, 1975
70.217
+14.507
26.04%
jan 1, 1976
69.407
-0.81
-1.15%
jan 1, 1977
63.636
-5.771
-8.31%
jan 1, 1978
60.825
-2.812
-4.42%
jan 1, 1979
64.259
+3.434
5.65%
jan 1, 1980
66.366
+2.107
3.28%
jan 1, 1981
70.99
+4.624
6.97%
jan 1, 1982
66.28
-4.711
-6.64%
jan 1, 1983
63.176
-3.104
-4.68%
jan 1, 1984
79.768
+16.593
26.26%
jan 1, 1985
73.994
-5.774
-7.24%
jan 1, 1986
80.899
+6.905
9.33%
jan 1, 1987
85.215
+4.316
5.33%
jan 1, 1988
78.697
-6.517
-7.65%
jan 1, 1989
78.957
+0.259
0.33%
jan 1, 1990
85.286
+6.329
8.02%
jan 1, 1991
84.184
-1.102
-1.29%
jan 1, 1992
83.73
-0.455
-0.54%
jan 1, 1993
91.221
+7.491
8.95%
jan 1, 1994
85.5
-5.721
-6.27%
jan 1, 1995
82.916
-2.584
-3.02%
jan 1, 1996
88.097
+5.181
6.25%
jan 1, 1997
86.197
-1.9
-2.16%
jan 1, 1998
83.739
-2.458
-2.85%
jan 1, 1999
83.064
-0.675
-0.81%
jan 1, 2000
87.912
+4.848
5.84%
jan 1, 2001
86.664
-1.248
-1.42%
jan 1, 2002
85.861
-0.803
-0.93%
jan 1, 2003
80.215
-5.646
-6.58%
jan 1, 2004
78.847
-1.368
-1.71%
jan 1, 2005
77.131
-1.716
-2.18%
jan 1, 2006
74.475
-2.656
-3.44%
jan 1, 2007
82.629
+8.154
10.95%
jan 1, 2008
78.239
-4.39
-5.31%
jan 1, 2009
77.635
-0.604
-0.77%
jan 1, 2010
85.133
+7.498
9.66%
jan 1, 2011
82.419
-2.714
-3.19%
jan 1, 2012
82.667
+0.249
0.3%
jan 1, 2013
84.014
+1.347
1.63%
jan 1, 2014
83.396
-0.618
-0.74%
Ranking of countries by current statistics by years


Comments: