29
/
en
AIzaSyAYiBZKx7MnpbEhh9jyipgxe19OcubqV5w
April 1, 2024
247350
Spain
ESP
true
2
1
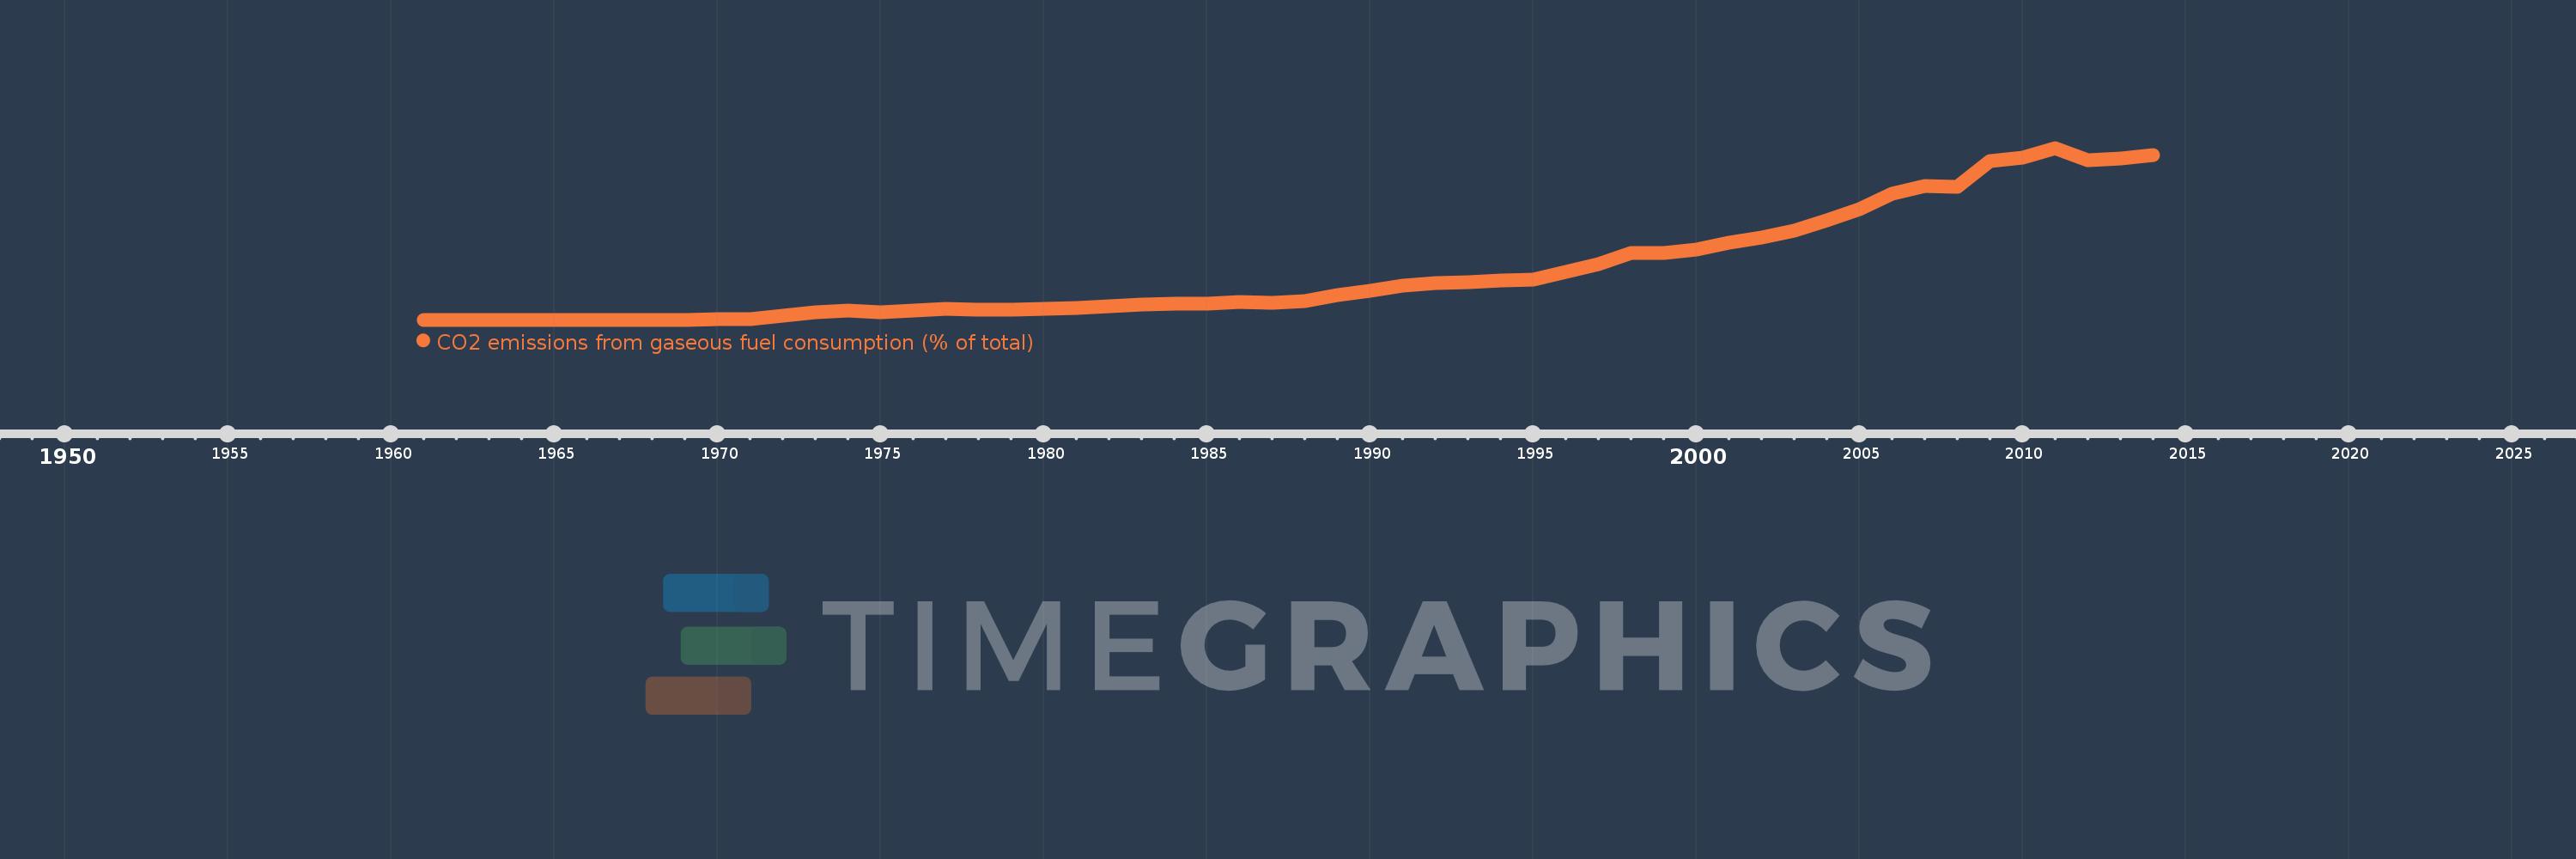
CO2 emissions from gaseous fuel consumption (% of total)
2014,2013,2012,2011,2010,2009,2008,2007,2006,2005,2004,2003,2002,2001,2000,1999,1998,1997,1996,1995,1994,1993,1992,1991,1990,1989,1988,1987,1986,1985,1984,1983,1982,1981,1980,1979,1978,1977,1976,1975,1974,1973,1972,1971,1970,1969,1968,1967,1966,1965,1964,1963,1962,1961
This statistics in other country:
AfghanistanAlbaniaAlgeriaAndorraAngolaAntigua and BarbudaArab WorldArgentinaArmeniaArubaAustraliaAustriaAzerbaijanBahamas, TheBahrainBangladeshBarbadosBelarusBelgiumBelizeBeninBermudaBhutanBoliviaBosnia and HerzegovinaBotswanaBrazilBritish Virgin IslandsBrunei DarussalamBulgariaBurkina FasoBurundiCabo VerdeCambodiaCameroonCanadaCaribbean small statesCayman IslandsCentral African RepublicCentral Europe and the BalticsChadChileChinaColombiaComorosCongo, Dem. Rep.Congo, Rep.Costa RicaCote d'IvoireCroatiaCubaCuracaoCyprusCzech RepublicDenmarkDjiboutiDominicaDominican RepublicEarly-demographic dividendEast Asia & PacificEast Asia & Pacific (excluding high income)East Asia & Pacific (IDA & IBRD countries)EcuadorEgypt, Arab Rep.El SalvadorEquatorial GuineaEritreaEstoniaEthiopiaEuro areaEurope & Central AsiaEurope & Central Asia (excluding high income)Europe & Central Asia (IDA & IBRD countries)European UnionFaroe IslandsFijiFinlandFragile and conflict affected situationsFranceFrench PolynesiaGabonGambia, TheGeorgiaGermanyGhanaGibraltarGreeceGreenlandGrenadaGuatemalaGuineaGuinea-BissauGuyanaHaitiHeavily indebted poor countries (HIPC)High incomeHondurasHong Kong SAR, ChinaHungaryIBRD onlyIcelandIDA & IBRD totalIDA blendIDA onlyIDA totalIndiaIndonesiaIran, Islamic Rep.IraqIrelandIsraelItalyJamaicaJapanJordanKazakhstanKenyaKiribatiKorea, Dem. People’s Rep.Korea, Rep.KuwaitKyrgyz RepublicLao PDRLate-demographic dividendLatin America & Caribbean Latin America & Caribbean (excluding high income)Latin America & the Caribbean (IDA & IBRD countries)LatviaLeast developed countries: UN classificationLebanonLesothoLiberiaLibyaLiechtensteinLithuaniaLow & middle incomeLow incomeLower middle incomeLuxembourgMacao SAR, ChinaMacedonia, FYRMadagascarMalawiMalaysiaMaldivesMaliMaltaMarshall IslandsMauritaniaMauritiusMexicoMicronesia, Fed. Sts.Middle East & North AfricaMiddle East & North Africa (excluding high income)Middle East & North Africa (IDA & IBRD countries)Middle incomeMoldovaMongoliaMontenegroMoroccoMozambiqueMyanmarNamibiaNauruNepalNetherlandsNew CaledoniaNew ZealandNicaraguaNigerNigeriaNorth AmericaNorwayOECD membersOmanOther small statesPacific island small statesPakistanPalauPanamaPapua New GuineaParaguayPeruPhilippinesPolandPortugalPost-demographic dividendPre-demographic dividendQatarRomaniaRussian FederationRwandaSamoaSao Tome and PrincipeSaudi ArabiaSenegalSerbiaSeychellesSierra LeoneSingaporeSint Maarten (Dutch part)Slovak RepublicSloveniaSmall statesSolomon IslandsSomaliaSouth AfricaSouth AsiaSouth Asia (IDA & IBRD)South SudanSpainSri LankaSt. Kitts and NevisSt. LuciaSt. Vincent and the GrenadinesSub-Saharan Africa Sub-Saharan Africa (excluding high income)Sub-Saharan Africa (IDA & IBRD countries)SudanSurinameSwazilandSwedenSwitzerlandSyrian Arab RepublicTajikistanTanzaniaThailandTimor-LesteTogoTongaTrinidad and TobagoTunisiaTurkeyTurkmenistanTurks and Caicos IslandsUgandaUkraineUnited Arab EmiratesUnited KingdomUnited StatesUpper middle incomeUruguayUzbekistanVanuatuVenezuela, RBVietnamWest Bank and GazaWorldYemen, Rep.ZambiaZimbabwe Timeline:
This timeline shows a graph from 1961 to 2014 of Spain. No data until 1960. Number of actual observations by date: 54.
Source name:
World Development Indicators
Source organization:
Carbon Dioxide Information Analysis Center, Environmental Sciences Division, Oak Ridge National Laboratory, Tennessee, United States.
Categories, topics:
Energy & Mining, Climate Change, Environment
Last updated:
apr 23, 2017
Indicators value changes by year
Maximum:
26.318
jan 1, 2011
At the date of observation
Value
Absolute change
Change from previous value
jan 1, 1964
0.006
+0.006
%
jan 1, 1965
0.006
-0.001
-8.68%
jan 1, 1966
0.01
+0.005
81.14%
jan 1, 1967
0.019
+0.009
82.99%
jan 1, 1968
0.008
-0.01
-55.08%
jan 1, 1969
0.004
-0.005
-55.47%
jan 1, 1970
0.132
+0.129
3.41K%
jan 1, 1971
0.141
+0.009
6.53%
jan 1, 1972
0.635
+0.494
350.3%
jan 1, 1973
1.123
+0.487
76.67%
jan 1, 1974
1.39
+0.268
23.83%
jan 1, 1975
1.197
-0.194
-13.93%
jan 1, 1976
1.399
+0.202
16.92%
jan 1, 1977
1.67
+0.271
19.4%
jan 1, 1978
1.569
-0.102
-6.1%
jan 1, 1979
1.542
-0.027
-1.71%
jan 1, 1980
1.722
+0.181
11.71%
jan 1, 1981
1.856
+0.133
7.74%
jan 1, 1982
2.128
+0.273
14.69%
jan 1, 1983
2.283
+0.155
7.29%
jan 1, 1984
2.461
+0.178
7.79%
jan 1, 1985
2.407
-0.054
-2.19%
jan 1, 1986
2.677
+0.27
11.21%
jan 1, 1987
2.64
-0.037
-1.4%
jan 1, 1988
2.876
+0.236
8.96%
jan 1, 1989
3.775
+0.899
31.27%
jan 1, 1990
4.47
+0.695
18.4%
jan 1, 1991
5.207
+0.737
16.49%
jan 1, 1992
5.683
+0.476
9.15%
jan 1, 1993
5.733
+0.049
0.87%
jan 1, 1994
5.999
+0.266
4.65%
jan 1, 1995
6.179
+0.18
3.0%
jan 1, 1996
7.32
+1.141
18.46%
jan 1, 1997
8.484
+1.164
15.91%
jan 1, 1998
10.275
+1.79
21.1%
jan 1, 1999
10.166
-0.108
-1.05%
jan 1, 2000
10.779
+0.613
6.03%
jan 1, 2001
11.839
+1.06
9.83%
jan 1, 2002
12.612
+0.772
6.52%
jan 1, 2003
13.655
+1.044
8.27%
jan 1, 2004
15.231
+1.576
11.54%
jan 1, 2005
16.985
+1.754
11.52%
jan 1, 2006
19.338
+2.353
13.85%
jan 1, 2007
20.437
+1.099
5.68%
jan 1, 2008
20.32
-0.117
-0.57%
jan 1, 2009
24.281
+3.961
19.5%
jan 1, 2010
24.811
+0.529
2.18%
jan 1, 2011
26.318
+1.507
6.07%
jan 1, 2012
24.496
-1.822
-6.92%
jan 1, 2013
24.717
+0.221
0.9%
jan 1, 2014
25.287
+0.57
2.31%
Ranking of countries by current statistics by years


Comments: