29
/
en
AIzaSyAYiBZKx7MnpbEhh9jyipgxe19OcubqV5w
April 1, 2024
35593
High income
HIC
false
2
1
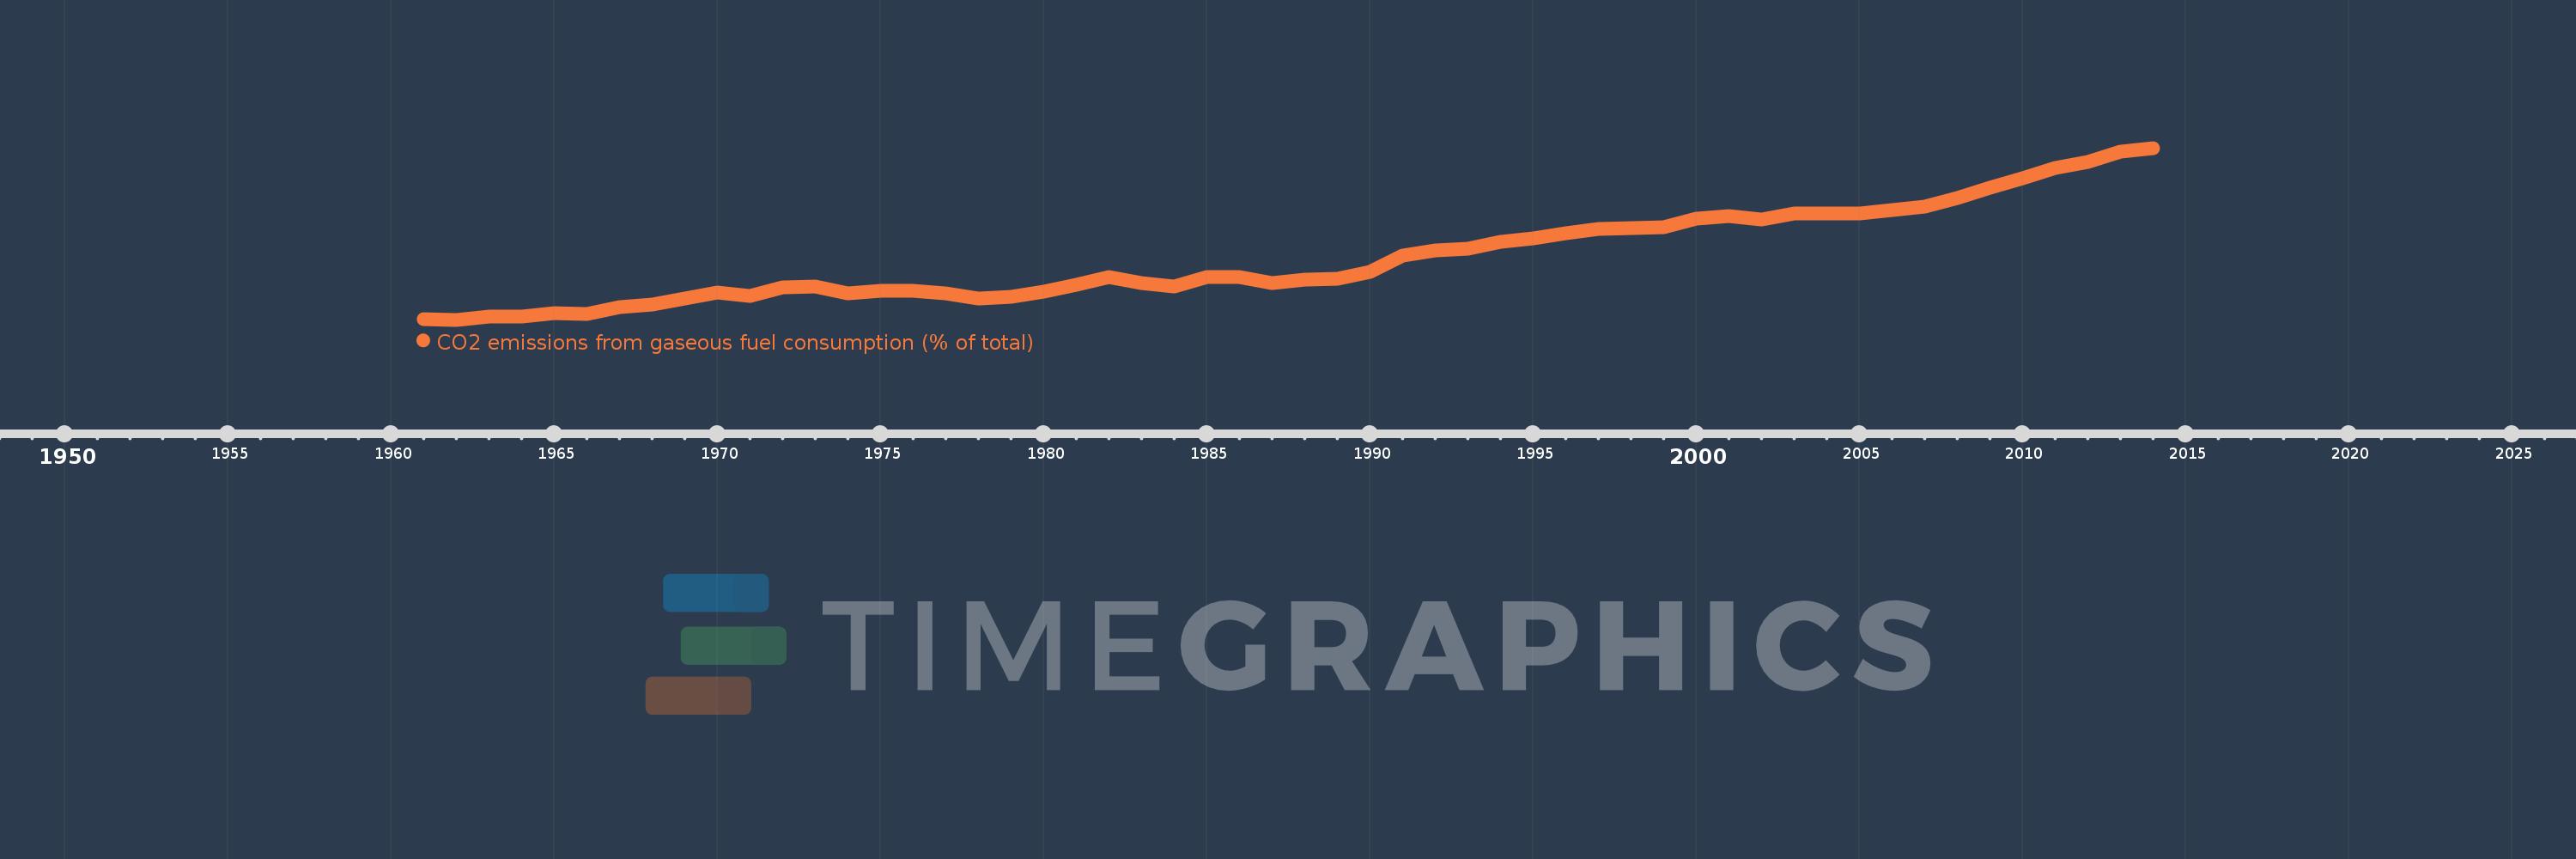
CO2 emissions from gaseous fuel consumption (% of total)
2014,2013,2012,2011,2010,2009,2008,2007,2006,2005,2004,2003,2002,2001,2000,1999,1998,1997,1996,1995,1994,1993,1992,1991,1990,1989,1988,1987,1986,1985,1984,1983,1982,1981,1980,1979,1978,1977,1976,1975,1974,1973,1972,1971,1970,1969,1968,1967,1966,1965,1964,1963,1962,1961
This statistics in other country:
AfghanistanAlbaniaAlgeriaAndorraAngolaAntigua and BarbudaArab WorldArgentinaArmeniaArubaAustraliaAustriaAzerbaijanBahamas, TheBahrainBangladeshBarbadosBelarusBelgiumBelizeBeninBermudaBhutanBoliviaBosnia and HerzegovinaBotswanaBrazilBritish Virgin IslandsBrunei DarussalamBulgariaBurkina FasoBurundiCabo VerdeCambodiaCameroonCanadaCaribbean small statesCayman IslandsCentral African RepublicCentral Europe and the BalticsChadChileChinaColombiaComorosCongo, Dem. Rep.Congo, Rep.Costa RicaCote d'IvoireCroatiaCubaCuracaoCyprusCzech RepublicDenmarkDjiboutiDominicaDominican RepublicEarly-demographic dividendEast Asia & PacificEast Asia & Pacific (excluding high income)East Asia & Pacific (IDA & IBRD countries)EcuadorEgypt, Arab Rep.El SalvadorEquatorial GuineaEritreaEstoniaEthiopiaEuro areaEurope & Central AsiaEurope & Central Asia (excluding high income)Europe & Central Asia (IDA & IBRD countries)European UnionFaroe IslandsFijiFinlandFragile and conflict affected situationsFranceFrench PolynesiaGabonGambia, TheGeorgiaGermanyGhanaGibraltarGreeceGreenlandGrenadaGuatemalaGuineaGuinea-BissauGuyanaHaitiHeavily indebted poor countries (HIPC)High incomeHondurasHong Kong SAR, ChinaHungaryIBRD onlyIcelandIDA & IBRD totalIDA blendIDA onlyIDA totalIndiaIndonesiaIran, Islamic Rep.IraqIrelandIsraelItalyJamaicaJapanJordanKazakhstanKenyaKiribatiKorea, Dem. People’s Rep.Korea, Rep.KuwaitKyrgyz RepublicLao PDRLate-demographic dividendLatin America & Caribbean Latin America & Caribbean (excluding high income)Latin America & the Caribbean (IDA & IBRD countries)LatviaLeast developed countries: UN classificationLebanonLesothoLiberiaLibyaLiechtensteinLithuaniaLow & middle incomeLow incomeLower middle incomeLuxembourgMacao SAR, ChinaMacedonia, FYRMadagascarMalawiMalaysiaMaldivesMaliMaltaMarshall IslandsMauritaniaMauritiusMexicoMicronesia, Fed. Sts.Middle East & North AfricaMiddle East & North Africa (excluding high income)Middle East & North Africa (IDA & IBRD countries)Middle incomeMoldovaMongoliaMontenegroMoroccoMozambiqueMyanmarNamibiaNauruNepalNetherlandsNew CaledoniaNew ZealandNicaraguaNigerNigeriaNorth AmericaNorwayOECD membersOmanOther small statesPacific island small statesPakistanPalauPanamaPapua New GuineaParaguayPeruPhilippinesPolandPortugalPost-demographic dividendPre-demographic dividendQatarRomaniaRussian FederationRwandaSamoaSao Tome and PrincipeSaudi ArabiaSenegalSerbiaSeychellesSierra LeoneSingaporeSint Maarten (Dutch part)Slovak RepublicSloveniaSmall statesSolomon IslandsSomaliaSouth AfricaSouth AsiaSouth Asia (IDA & IBRD)South SudanSpainSri LankaSt. Kitts and NevisSt. LuciaSt. Vincent and the GrenadinesSub-Saharan Africa Sub-Saharan Africa (excluding high income)Sub-Saharan Africa (IDA & IBRD countries)SudanSurinameSwazilandSwedenSwitzerlandSyrian Arab RepublicTajikistanTanzaniaThailandTimor-LesteTogoTongaTrinidad and TobagoTunisiaTurkeyTurkmenistanTurks and Caicos IslandsUgandaUkraineUnited Arab EmiratesUnited KingdomUnited StatesUpper middle incomeUruguayUzbekistanVanuatuVenezuela, RBVietnamWest Bank and GazaWorldYemen, Rep.ZambiaZimbabwe Timeline:
This timeline shows a graph from 1961 to 2014 of High income. No data until 1960. Number of actual observations by date: 54.
Source name:
World Development Indicators
Source organization:
Carbon Dioxide Information Analysis Center, Environmental Sciences Division, Oak Ridge National Laboratory, Tennessee, United States.
Categories, topics:
Energy & Mining, Climate Change, Environment
Last updated:
apr 23, 2017
Indicators value changes by year
Minimum:
13.286
jan 1, 1962
Maximum:
27.076
jan 1, 2014
At the date of observation
Value
Absolute change
Change from previous value
jan 1, 1961
13.338
+13.338
0.0%
jan 1, 1962
13.286
-0.052
-0.39%
jan 1, 1963
13.554
+0.268
2.02%
jan 1, 1964
13.556
+0.002
0.01%
jan 1, 1965
13.848
+0.292
2.16%
jan 1, 1966
13.776
-0.072
-0.52%
jan 1, 1967
14.297
+0.521
3.78%
jan 1, 1968
14.484
+0.187
1.31%
jan 1, 1969
14.99
+0.505
3.49%
jan 1, 1970
15.458
+0.468
3.12%
jan 1, 1971
15.199
-0.258
-1.67%
jan 1, 1972
15.861
+0.661
4.35%
jan 1, 1973
15.94
+0.079
0.5%
jan 1, 1974
15.408
-0.532
-3.34%
jan 1, 1975
15.6
+0.192
1.24%
jan 1, 1976
15.588
-0.012
-0.07%
jan 1, 1977
15.414
-0.174
-1.11%
jan 1, 1978
14.957
-0.457
-2.96%
jan 1, 1979
15.117
+0.159
1.07%
jan 1, 1980
15.541
+0.424
2.81%
jan 1, 1981
16.118
+0.576
3.71%
jan 1, 1982
16.741
+0.624
3.87%
jan 1, 1983
16.263
-0.478
-2.86%
jan 1, 1984
15.932
-0.331
-2.04%
jan 1, 1985
16.683
+0.751
4.72%
jan 1, 1986
16.704
+0.021
0.13%
jan 1, 1987
16.249
-0.455
-2.73%
jan 1, 1988
16.492
+0.243
1.5%
jan 1, 1989
16.565
+0.073
0.44%
jan 1, 1990
17.142
+0.577
3.48%
jan 1, 1991
18.449
+1.307
7.62%
jan 1, 1992
18.868
+0.419
2.27%
jan 1, 1993
18.98
+0.112
0.59%
jan 1, 1994
19.56
+0.58
3.06%
jan 1, 1995
19.805
+0.245
1.25%
jan 1, 1996
20.233
+0.428
2.16%
jan 1, 1997
20.576
+0.342
1.69%
jan 1, 1998
20.616
+0.041
0.2%
jan 1, 1999
20.738
+0.121
0.59%
jan 1, 2000
21.369
+0.631
3.04%
jan 1, 2001
21.605
+0.236
1.11%
jan 1, 2002
21.314
-0.292
-1.35%
jan 1, 2003
21.836
+0.522
2.45%
jan 1, 2004
21.811
-0.025
-0.11%
jan 1, 2005
21.833
+0.022
0.1%
jan 1, 2006
22.103
+0.27
1.23%
jan 1, 2007
22.361
+0.258
1.17%
jan 1, 2008
23.06
+0.699
3.13%
jan 1, 2009
23.874
+0.813
3.53%
jan 1, 2010
24.67
+0.797
3.34%
jan 1, 2011
25.448
+0.777
3.15%
jan 1, 2012
25.953
+0.505
1.98%
jan 1, 2013
26.786
+0.833
3.21%
jan 1, 2014
27.076
+0.29
1.08%
Ranking of countries by current statistics by years


Comments: