29
/
en
AIzaSyAYiBZKx7MnpbEhh9jyipgxe19OcubqV5w
April 1, 2024
27127
East Asia & Pacific
EAS
false
2
1
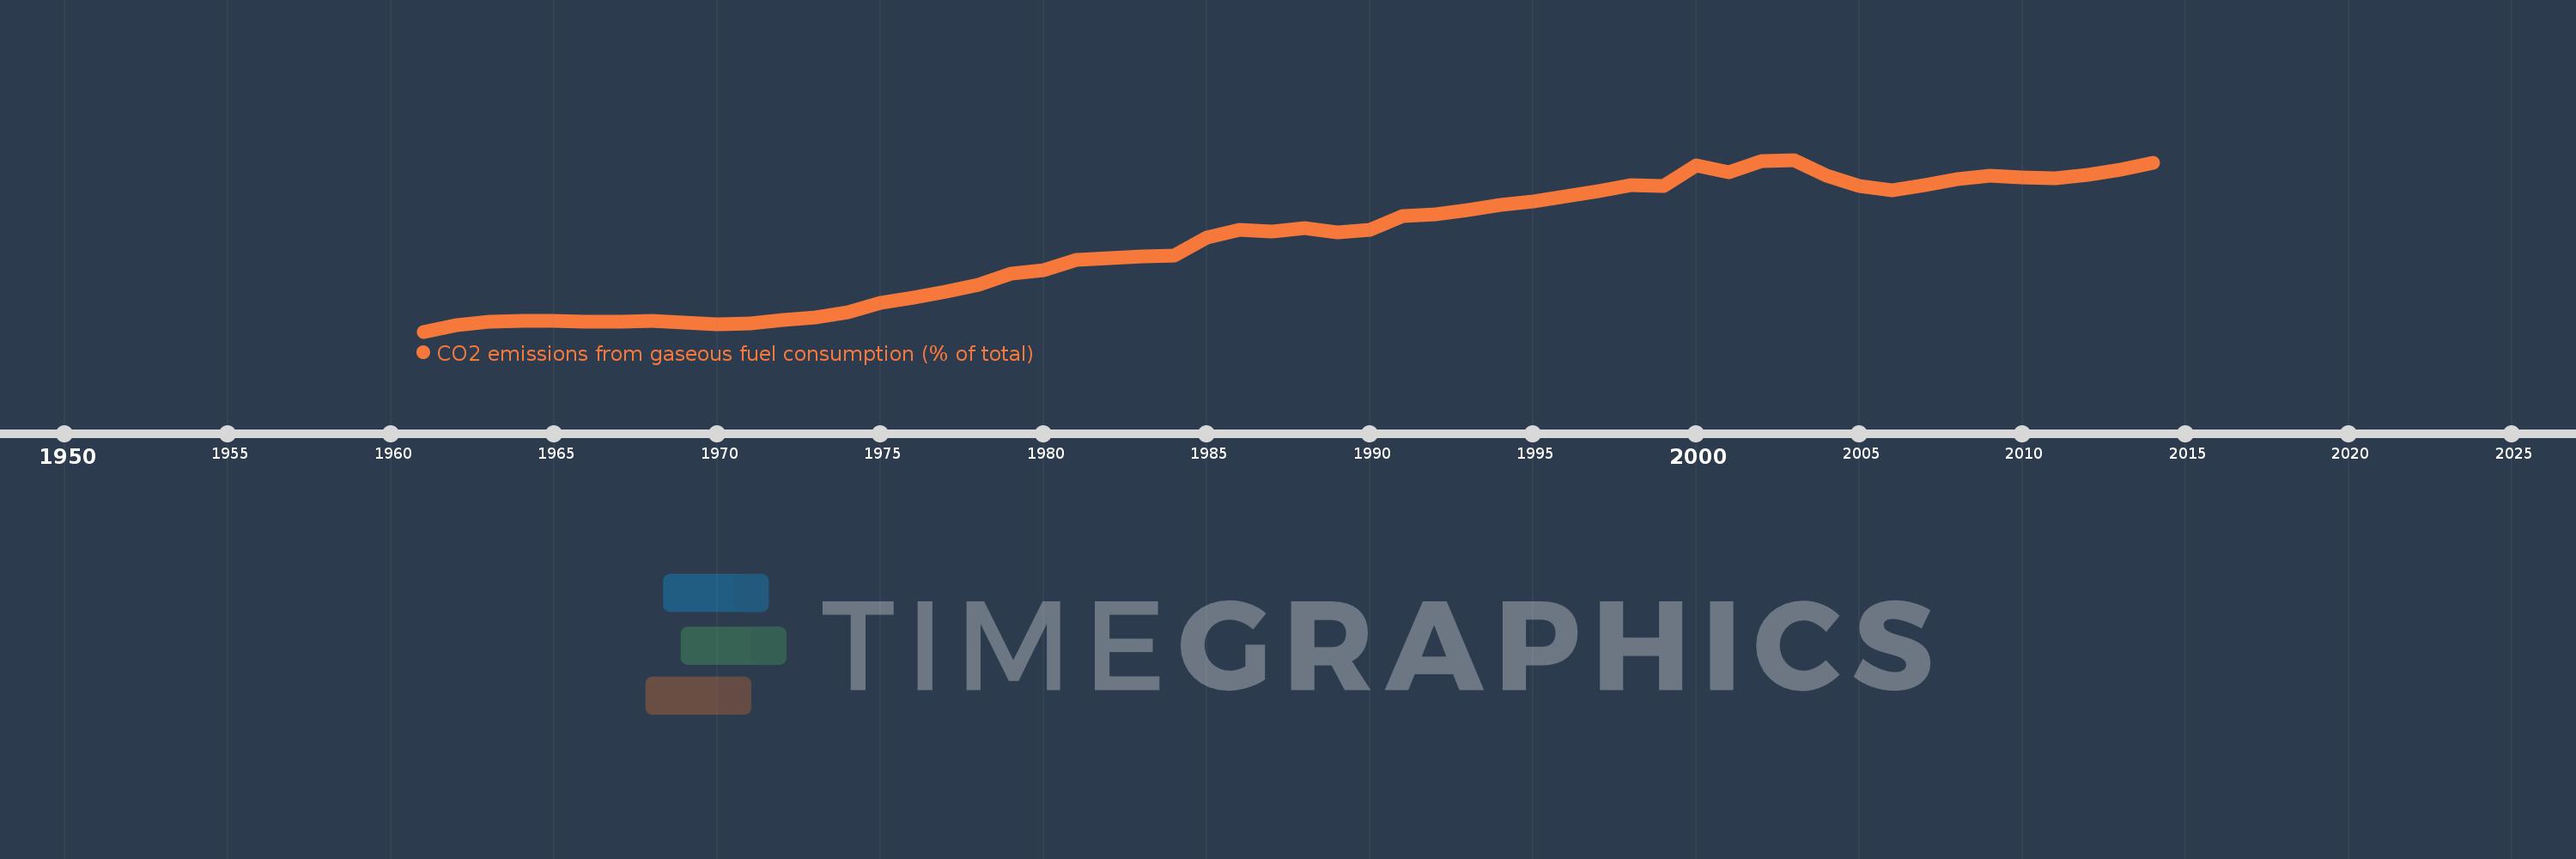
CO2 emissions from gaseous fuel consumption (% of total)
2014,2013,2012,2011,2010,2009,2008,2007,2006,2005,2004,2003,2002,2001,2000,1999,1998,1997,1996,1995,1994,1993,1992,1991,1990,1989,1988,1987,1986,1985,1984,1983,1982,1981,1980,1979,1978,1977,1976,1975,1974,1973,1972,1971,1970,1969,1968,1967,1966,1965,1964,1963,1962,1961
This statistics in other country:
AfghanistanAlbaniaAlgeriaAndorraAngolaAntigua and BarbudaArab WorldArgentinaArmeniaArubaAustraliaAustriaAzerbaijanBahamas, TheBahrainBangladeshBarbadosBelarusBelgiumBelizeBeninBermudaBhutanBoliviaBosnia and HerzegovinaBotswanaBrazilBritish Virgin IslandsBrunei DarussalamBulgariaBurkina FasoBurundiCabo VerdeCambodiaCameroonCanadaCaribbean small statesCayman IslandsCentral African RepublicCentral Europe and the BalticsChadChileChinaColombiaComorosCongo, Dem. Rep.Congo, Rep.Costa RicaCote d'IvoireCroatiaCubaCuracaoCyprusCzech RepublicDenmarkDjiboutiDominicaDominican RepublicEarly-demographic dividendEast Asia & PacificEast Asia & Pacific (excluding high income)East Asia & Pacific (IDA & IBRD countries)EcuadorEgypt, Arab Rep.El SalvadorEquatorial GuineaEritreaEstoniaEthiopiaEuro areaEurope & Central AsiaEurope & Central Asia (excluding high income)Europe & Central Asia (IDA & IBRD countries)European UnionFaroe IslandsFijiFinlandFragile and conflict affected situationsFranceFrench PolynesiaGabonGambia, TheGeorgiaGermanyGhanaGibraltarGreeceGreenlandGrenadaGuatemalaGuineaGuinea-BissauGuyanaHaitiHeavily indebted poor countries (HIPC)High incomeHondurasHong Kong SAR, ChinaHungaryIBRD onlyIcelandIDA & IBRD totalIDA blendIDA onlyIDA totalIndiaIndonesiaIran, Islamic Rep.IraqIrelandIsraelItalyJamaicaJapanJordanKazakhstanKenyaKiribatiKorea, Dem. People’s Rep.Korea, Rep.KuwaitKyrgyz RepublicLao PDRLate-demographic dividendLatin America & Caribbean Latin America & Caribbean (excluding high income)Latin America & the Caribbean (IDA & IBRD countries)LatviaLeast developed countries: UN classificationLebanonLesothoLiberiaLibyaLiechtensteinLithuaniaLow & middle incomeLow incomeLower middle incomeLuxembourgMacao SAR, ChinaMacedonia, FYRMadagascarMalawiMalaysiaMaldivesMaliMaltaMarshall IslandsMauritaniaMauritiusMexicoMicronesia, Fed. Sts.Middle East & North AfricaMiddle East & North Africa (excluding high income)Middle East & North Africa (IDA & IBRD countries)Middle incomeMoldovaMongoliaMontenegroMoroccoMozambiqueMyanmarNamibiaNauruNepalNetherlandsNew CaledoniaNew ZealandNicaraguaNigerNigeriaNorth AmericaNorwayOECD membersOmanOther small statesPacific island small statesPakistanPalauPanamaPapua New GuineaParaguayPeruPhilippinesPolandPortugalPost-demographic dividendPre-demographic dividendQatarRomaniaRussian FederationRwandaSamoaSao Tome and PrincipeSaudi ArabiaSenegalSerbiaSeychellesSierra LeoneSingaporeSint Maarten (Dutch part)Slovak RepublicSloveniaSmall statesSolomon IslandsSomaliaSouth AfricaSouth AsiaSouth Asia (IDA & IBRD)South SudanSpainSri LankaSt. Kitts and NevisSt. LuciaSt. Vincent and the GrenadinesSub-Saharan Africa Sub-Saharan Africa (excluding high income)Sub-Saharan Africa (IDA & IBRD countries)SudanSurinameSwazilandSwedenSwitzerlandSyrian Arab RepublicTajikistanTanzaniaThailandTimor-LesteTogoTongaTrinidad and TobagoTunisiaTurkeyTurkmenistanTurks and Caicos IslandsUgandaUkraineUnited Arab EmiratesUnited KingdomUnited StatesUpper middle incomeUruguayUzbekistanVanuatuVenezuela, RBVietnamWest Bank and GazaWorldYemen, Rep.ZambiaZimbabwe Timeline:
This timeline shows a graph from 1961 to 2014 of East Asia & Pacific. No data until 1960. Number of actual observations by date: 54.
Source name:
World Development Indicators
Source organization:
Carbon Dioxide Information Analysis Center, Environmental Sciences Division, Oak Ridge National Laboratory, Tennessee, United States.
Categories, topics:
Energy & Mining, Climate Change, Environment
Last updated:
apr 23, 2017
Indicators value changes by year
At the date of observation
Value
Absolute change
Change from previous value
jan 1, 1961
0.728
+0.728
0.0%
jan 1, 1962
0.994
+0.266
36.49%
jan 1, 1963
1.135
+0.141
14.19%
jan 1, 1964
1.174
+0.039
3.39%
jan 1, 1965
1.155
-0.019
-1.6%
jan 1, 1966
1.139
-0.016
-1.41%
jan 1, 1967
1.115
-0.024
-2.08%
jan 1, 1968
1.158
+0.043
3.82%
jan 1, 1969
1.101
-0.057
-4.89%
jan 1, 1970
1.014
-0.088
-7.95%
jan 1, 1971
1.062
+0.048
4.74%
jan 1, 1972
1.189
+0.128
12.04%
jan 1, 1973
1.296
+0.107
8.96%
jan 1, 1974
1.515
+0.219
16.92%
jan 1, 1975
1.871
+0.355
23.44%
jan 1, 1976
2.103
+0.232
12.42%
jan 1, 1977
2.327
+0.224
10.67%
jan 1, 1978
2.601
+0.274
11.77%
jan 1, 1979
3.047
+0.446
17.15%
jan 1, 1980
3.183
+0.136
4.46%
jan 1, 1981
3.61
+0.427
13.4%
jan 1, 1982
3.663
+0.054
1.49%
jan 1, 1983
3.755
+0.092
2.51%
jan 1, 1984
3.773
+0.018
0.48%
jan 1, 1985
4.509
+0.736
19.5%
jan 1, 1986
4.822
+0.312
6.93%
jan 1, 1987
4.757
-0.065
-1.34%
jan 1, 1988
4.886
+0.129
2.71%
jan 1, 1989
4.718
-0.168
-3.45%
jan 1, 1990
4.828
+0.11
2.33%
jan 1, 1991
5.386
+0.558
11.57%
jan 1, 1992
5.454
+0.068
1.26%
jan 1, 1993
5.602
+0.148
2.72%
jan 1, 1994
5.808
+0.206
3.69%
jan 1, 1995
5.952
+0.144
2.48%
jan 1, 1996
6.175
+0.223
3.74%
jan 1, 1997
6.382
+0.207
3.36%
jan 1, 1998
6.628
+0.246
3.85%
jan 1, 1999
6.584
-0.045
-0.68%
jan 1, 2000
7.405
+0.821
12.47%
jan 1, 2001
7.146
-0.259
-3.5%
jan 1, 2002
7.593
+0.447
6.26%
jan 1, 2003
7.63
+0.036
0.48%
jan 1, 2004
6.985
-0.644
-8.45%
jan 1, 2005
6.588
-0.397
-5.68%
jan 1, 2006
6.415
-0.174
-2.63%
jan 1, 2007
6.615
+0.2
3.12%
jan 1, 2008
6.869
+0.254
3.84%
jan 1, 2009
6.983
+0.115
1.67%
jan 1, 2010
6.908
-0.075
-1.08%
jan 1, 2011
6.876
-0.032
-0.46%
jan 1, 2012
7.012
+0.136
1.97%
jan 1, 2013
7.218
+0.206
2.94%
jan 1, 2014
7.492
+0.273
3.79%
Ranking of countries by current statistics by years


Comments: