29
/
en
AIzaSyAYiBZKx7MnpbEhh9jyipgxe19OcubqV5w
April 1, 2024
36412
IBRD only
IBD
false
2
1
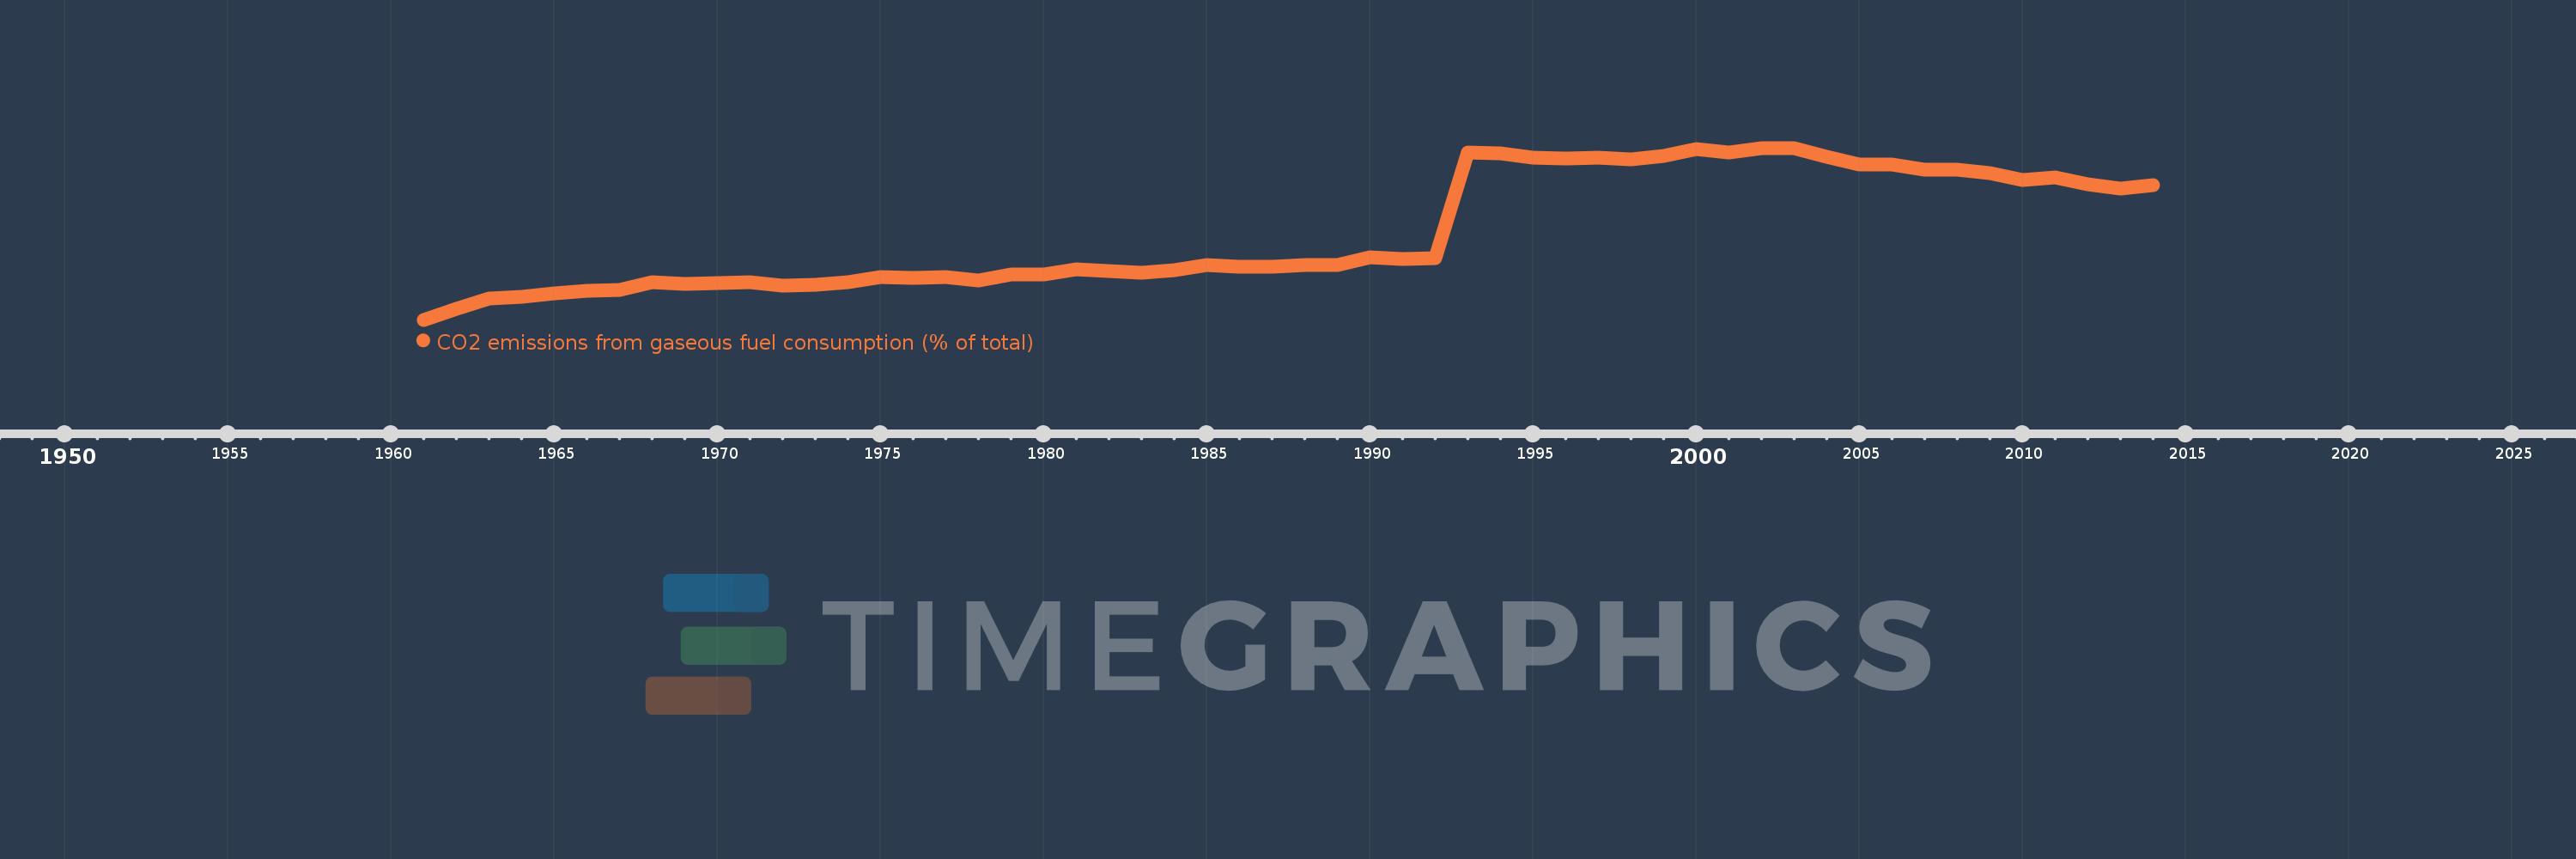
CO2 emissions from gaseous fuel consumption (% of total)
2014,2013,2012,2011,2010,2009,2008,2007,2006,2005,2004,2003,2002,2001,2000,1999,1998,1997,1996,1995,1994,1993,1992,1991,1990,1989,1988,1987,1986,1985,1984,1983,1982,1981,1980,1979,1978,1977,1976,1975,1974,1973,1972,1971,1970,1969,1968,1967,1966,1965,1964,1963,1962,1961
This statistics in other country:
AfghanistanAlbaniaAlgeriaAndorraAngolaAntigua and BarbudaArab WorldArgentinaArmeniaArubaAustraliaAustriaAzerbaijanBahamas, TheBahrainBangladeshBarbadosBelarusBelgiumBelizeBeninBermudaBhutanBoliviaBosnia and HerzegovinaBotswanaBrazilBritish Virgin IslandsBrunei DarussalamBulgariaBurkina FasoBurundiCabo VerdeCambodiaCameroonCanadaCaribbean small statesCayman IslandsCentral African RepublicCentral Europe and the BalticsChadChileChinaColombiaComorosCongo, Dem. Rep.Congo, Rep.Costa RicaCote d'IvoireCroatiaCubaCuracaoCyprusCzech RepublicDenmarkDjiboutiDominicaDominican RepublicEarly-demographic dividendEast Asia & PacificEast Asia & Pacific (excluding high income)East Asia & Pacific (IDA & IBRD countries)EcuadorEgypt, Arab Rep.El SalvadorEquatorial GuineaEritreaEstoniaEthiopiaEuro areaEurope & Central AsiaEurope & Central Asia (excluding high income)Europe & Central Asia (IDA & IBRD countries)European UnionFaroe IslandsFijiFinlandFragile and conflict affected situationsFranceFrench PolynesiaGabonGambia, TheGeorgiaGermanyGhanaGibraltarGreeceGreenlandGrenadaGuatemalaGuineaGuinea-BissauGuyanaHaitiHeavily indebted poor countries (HIPC)High incomeHondurasHong Kong SAR, ChinaHungaryIBRD onlyIcelandIDA & IBRD totalIDA blendIDA onlyIDA totalIndiaIndonesiaIran, Islamic Rep.IraqIrelandIsraelItalyJamaicaJapanJordanKazakhstanKenyaKiribatiKorea, Dem. People’s Rep.Korea, Rep.KuwaitKyrgyz RepublicLao PDRLate-demographic dividendLatin America & Caribbean Latin America & Caribbean (excluding high income)Latin America & the Caribbean (IDA & IBRD countries)LatviaLeast developed countries: UN classificationLebanonLesothoLiberiaLibyaLiechtensteinLithuaniaLow & middle incomeLow incomeLower middle incomeLuxembourgMacao SAR, ChinaMacedonia, FYRMadagascarMalawiMalaysiaMaldivesMaliMaltaMarshall IslandsMauritaniaMauritiusMexicoMicronesia, Fed. Sts.Middle East & North AfricaMiddle East & North Africa (excluding high income)Middle East & North Africa (IDA & IBRD countries)Middle incomeMoldovaMongoliaMontenegroMoroccoMozambiqueMyanmarNamibiaNauruNepalNetherlandsNew CaledoniaNew ZealandNicaraguaNigerNigeriaNorth AmericaNorwayOECD membersOmanOther small statesPacific island small statesPakistanPalauPanamaPapua New GuineaParaguayPeruPhilippinesPolandPortugalPost-demographic dividendPre-demographic dividendQatarRomaniaRussian FederationRwandaSamoaSao Tome and PrincipeSaudi ArabiaSenegalSerbiaSeychellesSierra LeoneSingaporeSint Maarten (Dutch part)Slovak RepublicSloveniaSmall statesSolomon IslandsSomaliaSouth AfricaSouth AsiaSouth Asia (IDA & IBRD)South SudanSpainSri LankaSt. Kitts and NevisSt. LuciaSt. Vincent and the GrenadinesSub-Saharan Africa Sub-Saharan Africa (excluding high income)Sub-Saharan Africa (IDA & IBRD countries)SudanSurinameSwazilandSwedenSwitzerlandSyrian Arab RepublicTajikistanTanzaniaThailandTimor-LesteTogoTongaTrinidad and TobagoTunisiaTurkeyTurkmenistanTurks and Caicos IslandsUgandaUkraineUnited Arab EmiratesUnited KingdomUnited StatesUpper middle incomeUruguayUzbekistanVanuatuVenezuela, RBVietnamWest Bank and GazaWorldYemen, Rep.ZambiaZimbabwe Timeline:
This timeline shows a graph from 1961 to 2014 of IBRD only. No data until 1960. Number of actual observations by date: 54.
Source name:
World Development Indicators
Source organization:
Carbon Dioxide Information Analysis Center, Environmental Sciences Division, Oak Ridge National Laboratory, Tennessee, United States.
Categories, topics:
Energy & Mining, Climate Change, Environment
Last updated:
apr 23, 2017
Indicators value changes by year
Maximum:
17.551
jan 1, 2002
At the date of observation
Value
Absolute change
Change from previous value
jan 1, 1961
3.107
+3.107
0.0%
jan 1, 1962
4.01
+0.904
29.09%
jan 1, 1963
4.856
+0.846
21.1%
jan 1, 1964
5.011
+0.155
3.18%
jan 1, 1965
5.297
+0.286
5.71%
jan 1, 1966
5.514
+0.217
4.09%
jan 1, 1967
5.591
+0.077
1.4%
jan 1, 1968
6.254
+0.663
11.86%
jan 1, 1969
6.083
-0.171
-2.73%
jan 1, 1970
6.177
+0.094
1.55%
jan 1, 1971
6.274
+0.097
1.56%
jan 1, 1972
6.005
-0.268
-4.28%
jan 1, 1973
6.034
+0.029
0.48%
jan 1, 1974
6.299
+0.265
4.39%
jan 1, 1975
6.664
+0.365
5.79%
jan 1, 1976
6.646
-0.018
-0.27%
jan 1, 1977
6.689
+0.044
0.66%
jan 1, 1978
6.413
-0.277
-4.14%
jan 1, 1979
6.895
+0.483
7.53%
jan 1, 1980
6.879
-0.016
-0.23%
jan 1, 1981
7.323
+0.443
6.45%
jan 1, 1982
7.182
-0.141
-1.92%
jan 1, 1983
7.043
-0.14
-1.94%
jan 1, 1984
7.309
+0.266
3.78%
jan 1, 1985
7.742
+0.433
5.93%
jan 1, 1986
7.553
-0.189
-2.44%
jan 1, 1987
7.546
-0.007
-0.1%
jan 1, 1988
7.672
+0.126
1.67%
jan 1, 1989
7.684
+0.013
0.16%
jan 1, 1990
8.354
+0.67
8.72%
jan 1, 1991
8.209
-0.145
-1.74%
jan 1, 1992
8.252
+0.043
0.52%
jan 1, 1993
17.171
+8.92
108.1%
jan 1, 1994
17.076
-0.096
-0.56%
jan 1, 1995
16.741
-0.335
-1.96%
jan 1, 1996
16.676
-0.065
-0.39%
jan 1, 1997
16.753
+0.078
0.47%
jan 1, 1998
16.602
-0.152
-0.91%
jan 1, 1999
16.877
+0.275
1.66%
jan 1, 2000
17.459
+0.583
3.45%
jan 1, 2001
17.144
-0.316
-1.81%
jan 1, 2002
17.551
+0.407
2.37%
jan 1, 2003
17.548
-0.002
-0.01%
jan 1, 2004
16.812
-0.736
-4.2%
jan 1, 2005
16.156
-0.656
-3.9%
jan 1, 2006
16.146
-0.01
-0.06%
jan 1, 2007
15.742
-0.404
-2.5%
jan 1, 2008
15.74
-0.001
-0.01%
jan 1, 2009
15.404
-0.336
-2.14%
jan 1, 2010
14.823
-0.581
-3.77%
jan 1, 2011
15.053
+0.23
1.55%
jan 1, 2012
14.506
-0.547
-3.63%
jan 1, 2013
14.104
-0.402
-2.77%
jan 1, 2014
14.41
+0.306
2.17%
Ranking of countries by current statistics by years


Comments: