29
/
en
AIzaSyAYiBZKx7MnpbEhh9jyipgxe19OcubqV5w
April 1, 2024
161277
Italy
ITA
true
2
1
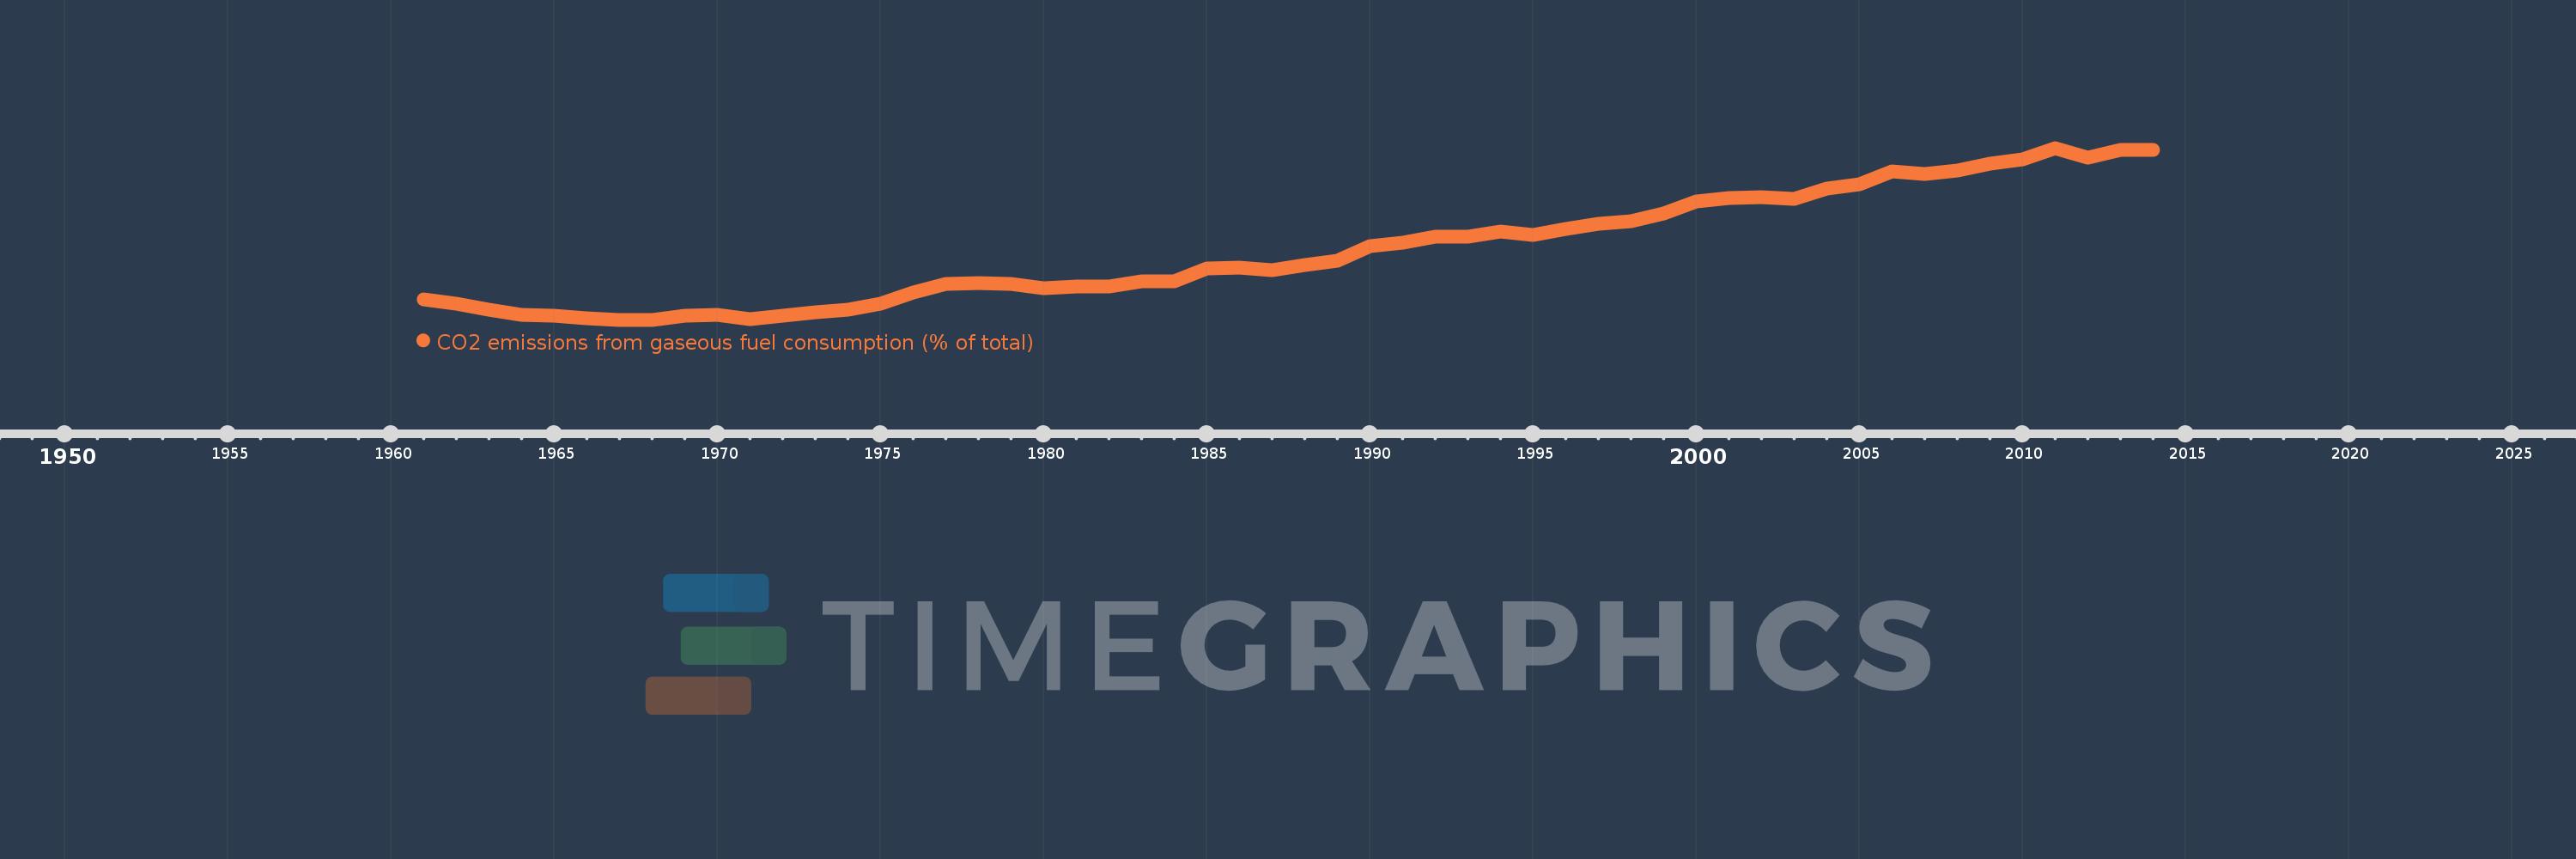
CO2 emissions from gaseous fuel consumption (% of total)
2014,2013,2012,2011,2010,2009,2008,2007,2006,2005,2004,2003,2002,2001,2000,1999,1998,1997,1996,1995,1994,1993,1992,1991,1990,1989,1988,1987,1986,1985,1984,1983,1982,1981,1980,1979,1978,1977,1976,1975,1974,1973,1972,1971,1970,1969,1968,1967,1966,1965,1964,1963,1962,1961
This statistics in other country:
AfghanistanAlbaniaAlgeriaAndorraAngolaAntigua and BarbudaArab WorldArgentinaArmeniaArubaAustraliaAustriaAzerbaijanBahamas, TheBahrainBangladeshBarbadosBelarusBelgiumBelizeBeninBermudaBhutanBoliviaBosnia and HerzegovinaBotswanaBrazilBritish Virgin IslandsBrunei DarussalamBulgariaBurkina FasoBurundiCabo VerdeCambodiaCameroonCanadaCaribbean small statesCayman IslandsCentral African RepublicCentral Europe and the BalticsChadChileChinaColombiaComorosCongo, Dem. Rep.Congo, Rep.Costa RicaCote d'IvoireCroatiaCubaCuracaoCyprusCzech RepublicDenmarkDjiboutiDominicaDominican RepublicEarly-demographic dividendEast Asia & PacificEast Asia & Pacific (excluding high income)East Asia & Pacific (IDA & IBRD countries)EcuadorEgypt, Arab Rep.El SalvadorEquatorial GuineaEritreaEstoniaEthiopiaEuro areaEurope & Central AsiaEurope & Central Asia (excluding high income)Europe & Central Asia (IDA & IBRD countries)European UnionFaroe IslandsFijiFinlandFragile and conflict affected situationsFranceFrench PolynesiaGabonGambia, TheGeorgiaGermanyGhanaGibraltarGreeceGreenlandGrenadaGuatemalaGuineaGuinea-BissauGuyanaHaitiHeavily indebted poor countries (HIPC)High incomeHondurasHong Kong SAR, ChinaHungaryIBRD onlyIcelandIDA & IBRD totalIDA blendIDA onlyIDA totalIndiaIndonesiaIran, Islamic Rep.IraqIrelandIsraelItalyJamaicaJapanJordanKazakhstanKenyaKiribatiKorea, Dem. People’s Rep.Korea, Rep.KuwaitKyrgyz RepublicLao PDRLate-demographic dividendLatin America & Caribbean Latin America & Caribbean (excluding high income)Latin America & the Caribbean (IDA & IBRD countries)LatviaLeast developed countries: UN classificationLebanonLesothoLiberiaLibyaLiechtensteinLithuaniaLow & middle incomeLow incomeLower middle incomeLuxembourgMacao SAR, ChinaMacedonia, FYRMadagascarMalawiMalaysiaMaldivesMaliMaltaMarshall IslandsMauritaniaMauritiusMexicoMicronesia, Fed. Sts.Middle East & North AfricaMiddle East & North Africa (excluding high income)Middle East & North Africa (IDA & IBRD countries)Middle incomeMoldovaMongoliaMontenegroMoroccoMozambiqueMyanmarNamibiaNauruNepalNetherlandsNew CaledoniaNew ZealandNicaraguaNigerNigeriaNorth AmericaNorwayOECD membersOmanOther small statesPacific island small statesPakistanPalauPanamaPapua New GuineaParaguayPeruPhilippinesPolandPortugalPost-demographic dividendPre-demographic dividendQatarRomaniaRussian FederationRwandaSamoaSao Tome and PrincipeSaudi ArabiaSenegalSerbiaSeychellesSierra LeoneSingaporeSint Maarten (Dutch part)Slovak RepublicSloveniaSmall statesSolomon IslandsSomaliaSouth AfricaSouth AsiaSouth Asia (IDA & IBRD)South SudanSpainSri LankaSt. Kitts and NevisSt. LuciaSt. Vincent and the GrenadinesSub-Saharan Africa Sub-Saharan Africa (excluding high income)Sub-Saharan Africa (IDA & IBRD countries)SudanSurinameSwazilandSwedenSwitzerlandSyrian Arab RepublicTajikistanTanzaniaThailandTimor-LesteTogoTongaTrinidad and TobagoTunisiaTurkeyTurkmenistanTurks and Caicos IslandsUgandaUkraineUnited Arab EmiratesUnited KingdomUnited StatesUpper middle incomeUruguayUzbekistanVanuatuVenezuela, RBVietnamWest Bank and GazaWorldYemen, Rep.ZambiaZimbabwe Timeline:
This timeline shows a graph from 1961 to 2014 of Italy. No data until 1960. Number of actual observations by date: 54.
Source name:
World Development Indicators
Source organization:
Carbon Dioxide Information Analysis Center, Environmental Sciences Division, Oak Ridge National Laboratory, Tennessee, United States.
Categories, topics:
Energy & Mining, Climate Change, Environment
Last updated:
apr 23, 2017
Indicators value changes by year
Maximum:
38.453
jan 1, 2011
At the date of observation
Value
Absolute change
Change from previous value
jan 1, 1961
11.056
+11.056
0.0%
jan 1, 1962
10.287
-0.769
-6.95%
jan 1, 1963
9.156
-1.131
-10.99%
jan 1, 1964
8.272
-0.885
-9.66%
jan 1, 1965
8.136
-0.136
-1.64%
jan 1, 1966
7.65
-0.486
-5.97%
jan 1, 1967
7.399
-0.251
-3.28%
jan 1, 1968
7.386
-0.013
-0.17%
jan 1, 1969
8.112
+0.725
9.82%
jan 1, 1970
8.283
+0.171
2.11%
jan 1, 1971
7.444
-0.839
-10.13%
jan 1, 1972
8.047
+0.603
8.1%
jan 1, 1973
8.807
+0.76
9.44%
jan 1, 1974
9.236
+0.429
4.87%
jan 1, 1975
10.321
+1.085
11.75%
jan 1, 1976
12.33
+2.009
19.46%
jan 1, 1977
13.898
+1.568
12.71%
jan 1, 1978
14.061
+0.163
1.17%
jan 1, 1979
13.931
-0.13
-0.92%
jan 1, 1980
13.142
-0.789
-5.66%
jan 1, 1981
13.442
+0.3
2.28%
jan 1, 1982
13.357
-0.085
-0.63%
jan 1, 1983
14.295
+0.938
7.02%
jan 1, 1984
14.267
-0.028
-0.2%
jan 1, 1985
16.586
+2.319
16.26%
jan 1, 1986
16.81
+0.224
1.35%
jan 1, 1987
16.286
-0.524
-3.12%
jan 1, 1988
17.245
+0.959
5.89%
jan 1, 1989
18.079
+0.834
4.84%
jan 1, 1990
20.641
+2.562
14.17%
jan 1, 1991
21.393
+0.751
3.64%
jan 1, 1992
22.409
+1.016
4.75%
jan 1, 1993
22.391
-0.018
-0.08%
jan 1, 1994
23.325
+0.934
4.17%
jan 1, 1995
22.79
-0.535
-2.29%
jan 1, 1996
23.757
+0.967
4.24%
jan 1, 1997
24.777
+1.02
4.29%
jan 1, 1998
25.264
+0.488
1.97%
jan 1, 1999
26.603
+1.339
5.3%
jan 1, 2000
28.794
+2.191
8.24%
jan 1, 2001
29.452
+0.658
2.28%
jan 1, 2002
29.547
+0.095
0.32%
jan 1, 2003
29.201
-0.346
-1.17%
jan 1, 2004
31.112
+1.911
6.54%
jan 1, 2005
31.902
+0.79
2.54%
jan 1, 2006
34.182
+2.281
7.15%
jan 1, 2007
33.765
-0.418
-1.22%
jan 1, 2008
34.419
+0.654
1.94%
jan 1, 2009
35.605
+1.186
3.45%
jan 1, 2010
36.444
+0.839
2.36%
jan 1, 2011
38.453
+2.009
5.51%
jan 1, 2012
36.723
-1.73
-4.5%
jan 1, 2013
38.036
+1.313
3.58%
jan 1, 2014
38.122
+0.086
0.23%
Ranking of countries by current statistics by years


Comments: