29
/
en
AIzaSyAYiBZKx7MnpbEhh9jyipgxe19OcubqV5w
April 1, 2024
159214
Ireland
IRL
true
2
1
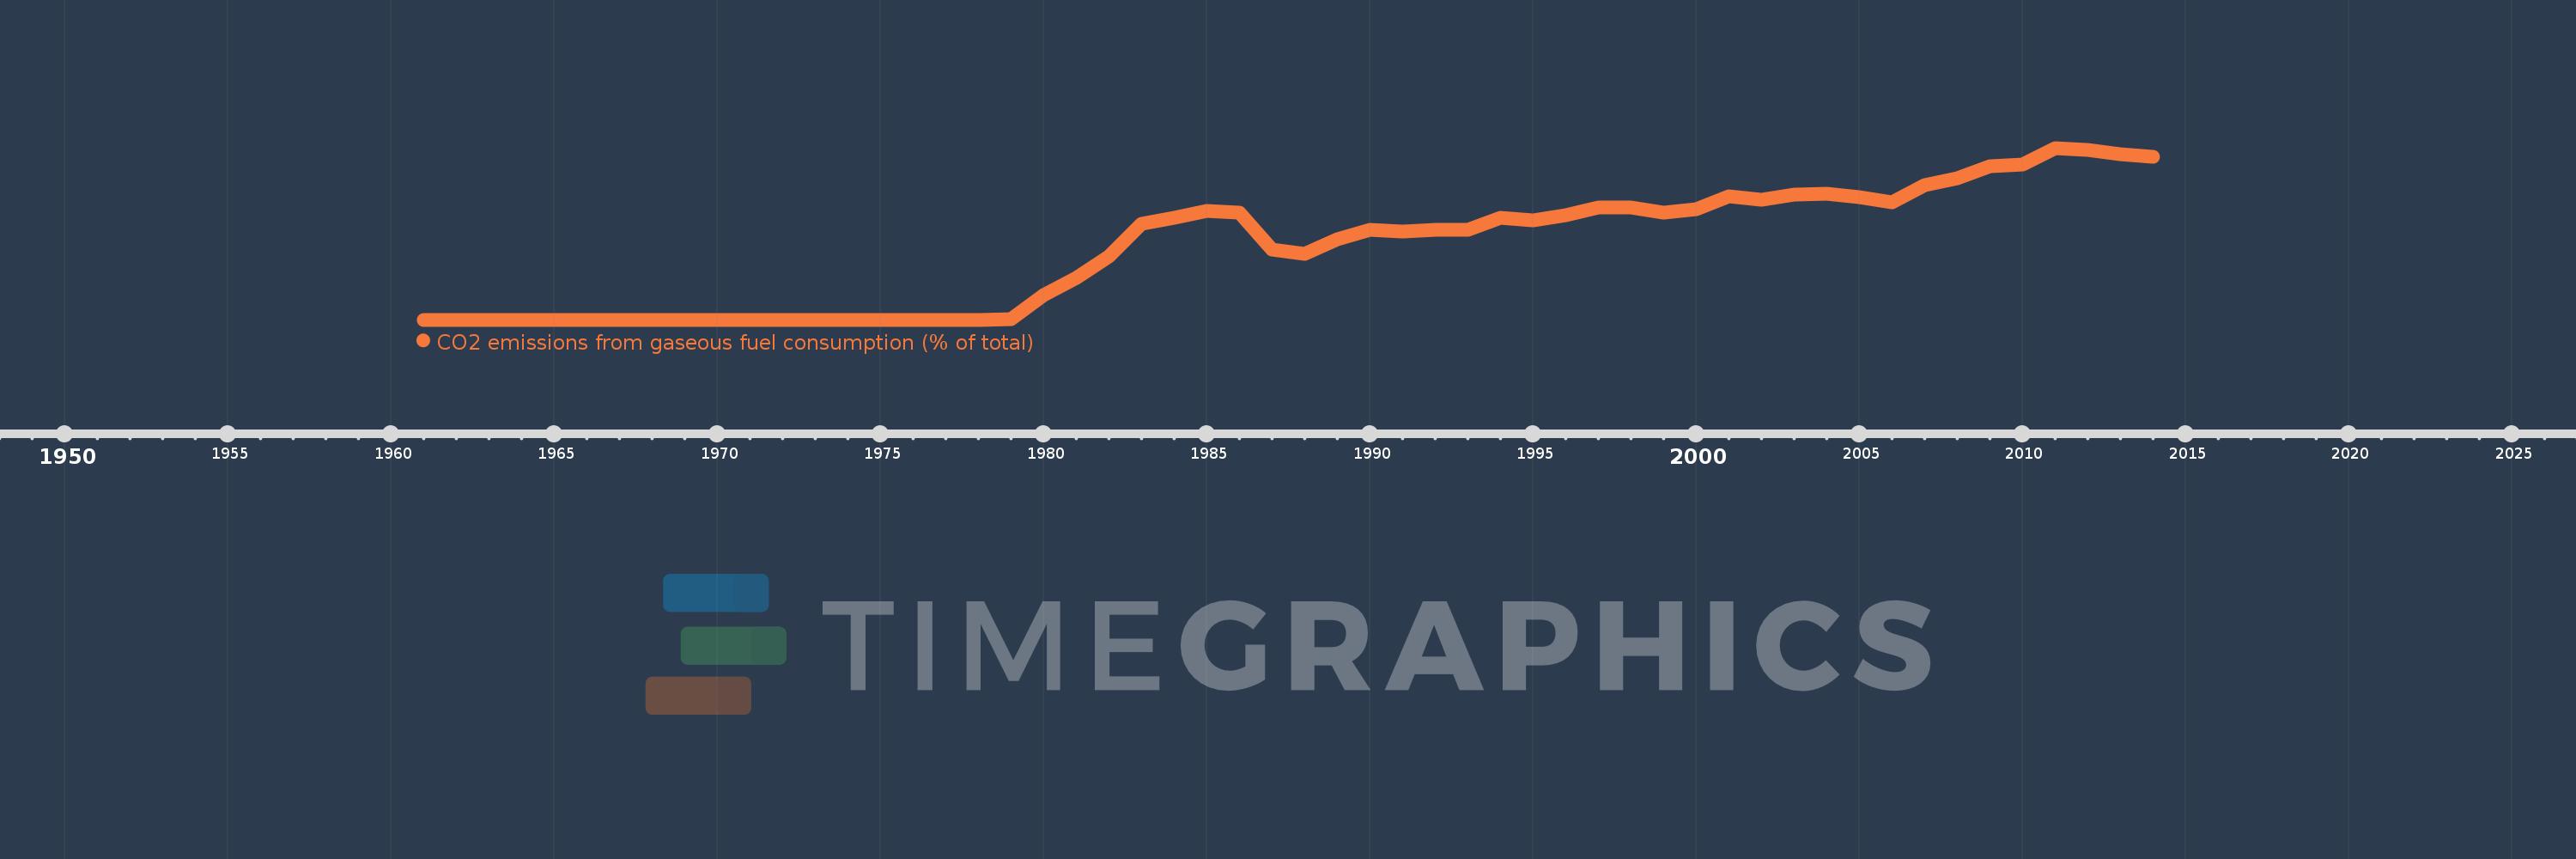
CO2 emissions from gaseous fuel consumption (% of total)
2014,2013,2012,2011,2010,2009,2008,2007,2006,2005,2004,2003,2002,2001,2000,1999,1998,1997,1996,1995,1994,1993,1992,1991,1990,1989,1988,1987,1986,1985,1984,1983,1982,1981,1980,1979,1978,1977,1976,1975,1974,1973,1972,1971,1970,1969,1968,1967,1966,1965,1964,1963,1962,1961
This statistics in other country:
AfghanistanAlbaniaAlgeriaAndorraAngolaAntigua and BarbudaArab WorldArgentinaArmeniaArubaAustraliaAustriaAzerbaijanBahamas, TheBahrainBangladeshBarbadosBelarusBelgiumBelizeBeninBermudaBhutanBoliviaBosnia and HerzegovinaBotswanaBrazilBritish Virgin IslandsBrunei DarussalamBulgariaBurkina FasoBurundiCabo VerdeCambodiaCameroonCanadaCaribbean small statesCayman IslandsCentral African RepublicCentral Europe and the BalticsChadChileChinaColombiaComorosCongo, Dem. Rep.Congo, Rep.Costa RicaCote d'IvoireCroatiaCubaCuracaoCyprusCzech RepublicDenmarkDjiboutiDominicaDominican RepublicEarly-demographic dividendEast Asia & PacificEast Asia & Pacific (excluding high income)East Asia & Pacific (IDA & IBRD countries)EcuadorEgypt, Arab Rep.El SalvadorEquatorial GuineaEritreaEstoniaEthiopiaEuro areaEurope & Central AsiaEurope & Central Asia (excluding high income)Europe & Central Asia (IDA & IBRD countries)European UnionFaroe IslandsFijiFinlandFragile and conflict affected situationsFranceFrench PolynesiaGabonGambia, TheGeorgiaGermanyGhanaGibraltarGreeceGreenlandGrenadaGuatemalaGuineaGuinea-BissauGuyanaHaitiHeavily indebted poor countries (HIPC)High incomeHondurasHong Kong SAR, ChinaHungaryIBRD onlyIcelandIDA & IBRD totalIDA blendIDA onlyIDA totalIndiaIndonesiaIran, Islamic Rep.IraqIrelandIsraelItalyJamaicaJapanJordanKazakhstanKenyaKiribatiKorea, Dem. People’s Rep.Korea, Rep.KuwaitKyrgyz RepublicLao PDRLate-demographic dividendLatin America & Caribbean Latin America & Caribbean (excluding high income)Latin America & the Caribbean (IDA & IBRD countries)LatviaLeast developed countries: UN classificationLebanonLesothoLiberiaLibyaLiechtensteinLithuaniaLow & middle incomeLow incomeLower middle incomeLuxembourgMacao SAR, ChinaMacedonia, FYRMadagascarMalawiMalaysiaMaldivesMaliMaltaMarshall IslandsMauritaniaMauritiusMexicoMicronesia, Fed. Sts.Middle East & North AfricaMiddle East & North Africa (excluding high income)Middle East & North Africa (IDA & IBRD countries)Middle incomeMoldovaMongoliaMontenegroMoroccoMozambiqueMyanmarNamibiaNauruNepalNetherlandsNew CaledoniaNew ZealandNicaraguaNigerNigeriaNorth AmericaNorwayOECD membersOmanOther small statesPacific island small statesPakistanPalauPanamaPapua New GuineaParaguayPeruPhilippinesPolandPortugalPost-demographic dividendPre-demographic dividendQatarRomaniaRussian FederationRwandaSamoaSao Tome and PrincipeSaudi ArabiaSenegalSerbiaSeychellesSierra LeoneSingaporeSint Maarten (Dutch part)Slovak RepublicSloveniaSmall statesSolomon IslandsSomaliaSouth AfricaSouth AsiaSouth Asia (IDA & IBRD)South SudanSpainSri LankaSt. Kitts and NevisSt. LuciaSt. Vincent and the GrenadinesSub-Saharan Africa Sub-Saharan Africa (excluding high income)Sub-Saharan Africa (IDA & IBRD countries)SudanSurinameSwazilandSwedenSwitzerlandSyrian Arab RepublicTajikistanTanzaniaThailandTimor-LesteTogoTongaTrinidad and TobagoTunisiaTurkeyTurkmenistanTurks and Caicos IslandsUgandaUkraineUnited Arab EmiratesUnited KingdomUnited StatesUpper middle incomeUruguayUzbekistanVanuatuVenezuela, RBVietnamWest Bank and GazaWorldYemen, Rep.ZambiaZimbabwe Timeline:
This timeline shows a graph from 1961 to 2014 of Ireland. No data until 1960. Number of actual observations by date: 54.
Source name:
World Development Indicators
Source organization:
Carbon Dioxide Information Analysis Center, Environmental Sciences Division, Oak Ridge National Laboratory, Tennessee, United States.
Categories, topics:
Energy & Mining, Climate Change, Environment
Last updated:
apr 23, 2017
Indicators value changes by year
Maximum:
26.654
jan 1, 2011
At the date of observation
Value
Absolute change
Change from previous value
jan 1, 1979
0.078
+0.078
%
jan 1, 1980
3.856
+3.778
4.86K%
jan 1, 1981
6.425
+2.569
66.62%
jan 1, 1982
9.872
+3.447
53.66%
jan 1, 1983
14.856
+4.984
50.49%
jan 1, 1984
15.818
+0.962
6.48%
jan 1, 1985
16.892
+1.074
6.79%
jan 1, 1986
16.685
-0.207
-1.22%
jan 1, 1987
10.914
-5.771
-34.59%
jan 1, 1988
10.213
-0.701
-6.43%
jan 1, 1989
12.485
+2.272
22.25%
jan 1, 1990
14.0
+1.515
12.13%
jan 1, 1991
13.732
-0.267
-1.91%
jan 1, 1992
14.002
+0.27
1.96%
jan 1, 1993
14.014
+0.012
0.08%
jan 1, 1994
15.801
+1.787
12.75%
jan 1, 1995
15.376
-0.425
-2.69%
jan 1, 1996
16.216
+0.84
5.46%
jan 1, 1997
17.397
+1.181
7.28%
jan 1, 1998
17.43
+0.033
0.19%
jan 1, 1999
16.644
-0.786
-4.51%
jan 1, 2000
17.096
+0.451
2.71%
jan 1, 2001
19.087
+1.992
11.65%
jan 1, 2002
18.639
-0.448
-2.35%
jan 1, 2003
19.41
+0.771
4.14%
jan 1, 2004
19.595
+0.184
0.95%
jan 1, 2005
19.08
-0.515
-2.63%
jan 1, 2006
18.251
-0.828
-4.34%
jan 1, 2007
20.884
+2.632
14.42%
jan 1, 2008
21.958
+1.075
5.15%
jan 1, 2009
23.844
+1.886
8.59%
jan 1, 2010
24.094
+0.25
1.05%
jan 1, 2011
26.654
+2.56
10.62%
jan 1, 2012
26.315
-0.339
-1.27%
jan 1, 2013
25.737
-0.579
-2.2%
jan 1, 2014
25.338
-0.398
-1.55%
Ranking of countries by current statistics by years


Comments: