29
/
en
AIzaSyAYiBZKx7MnpbEhh9jyipgxe19OcubqV5w
April 1, 2024
227227
Qatar
QAT
true
2
1
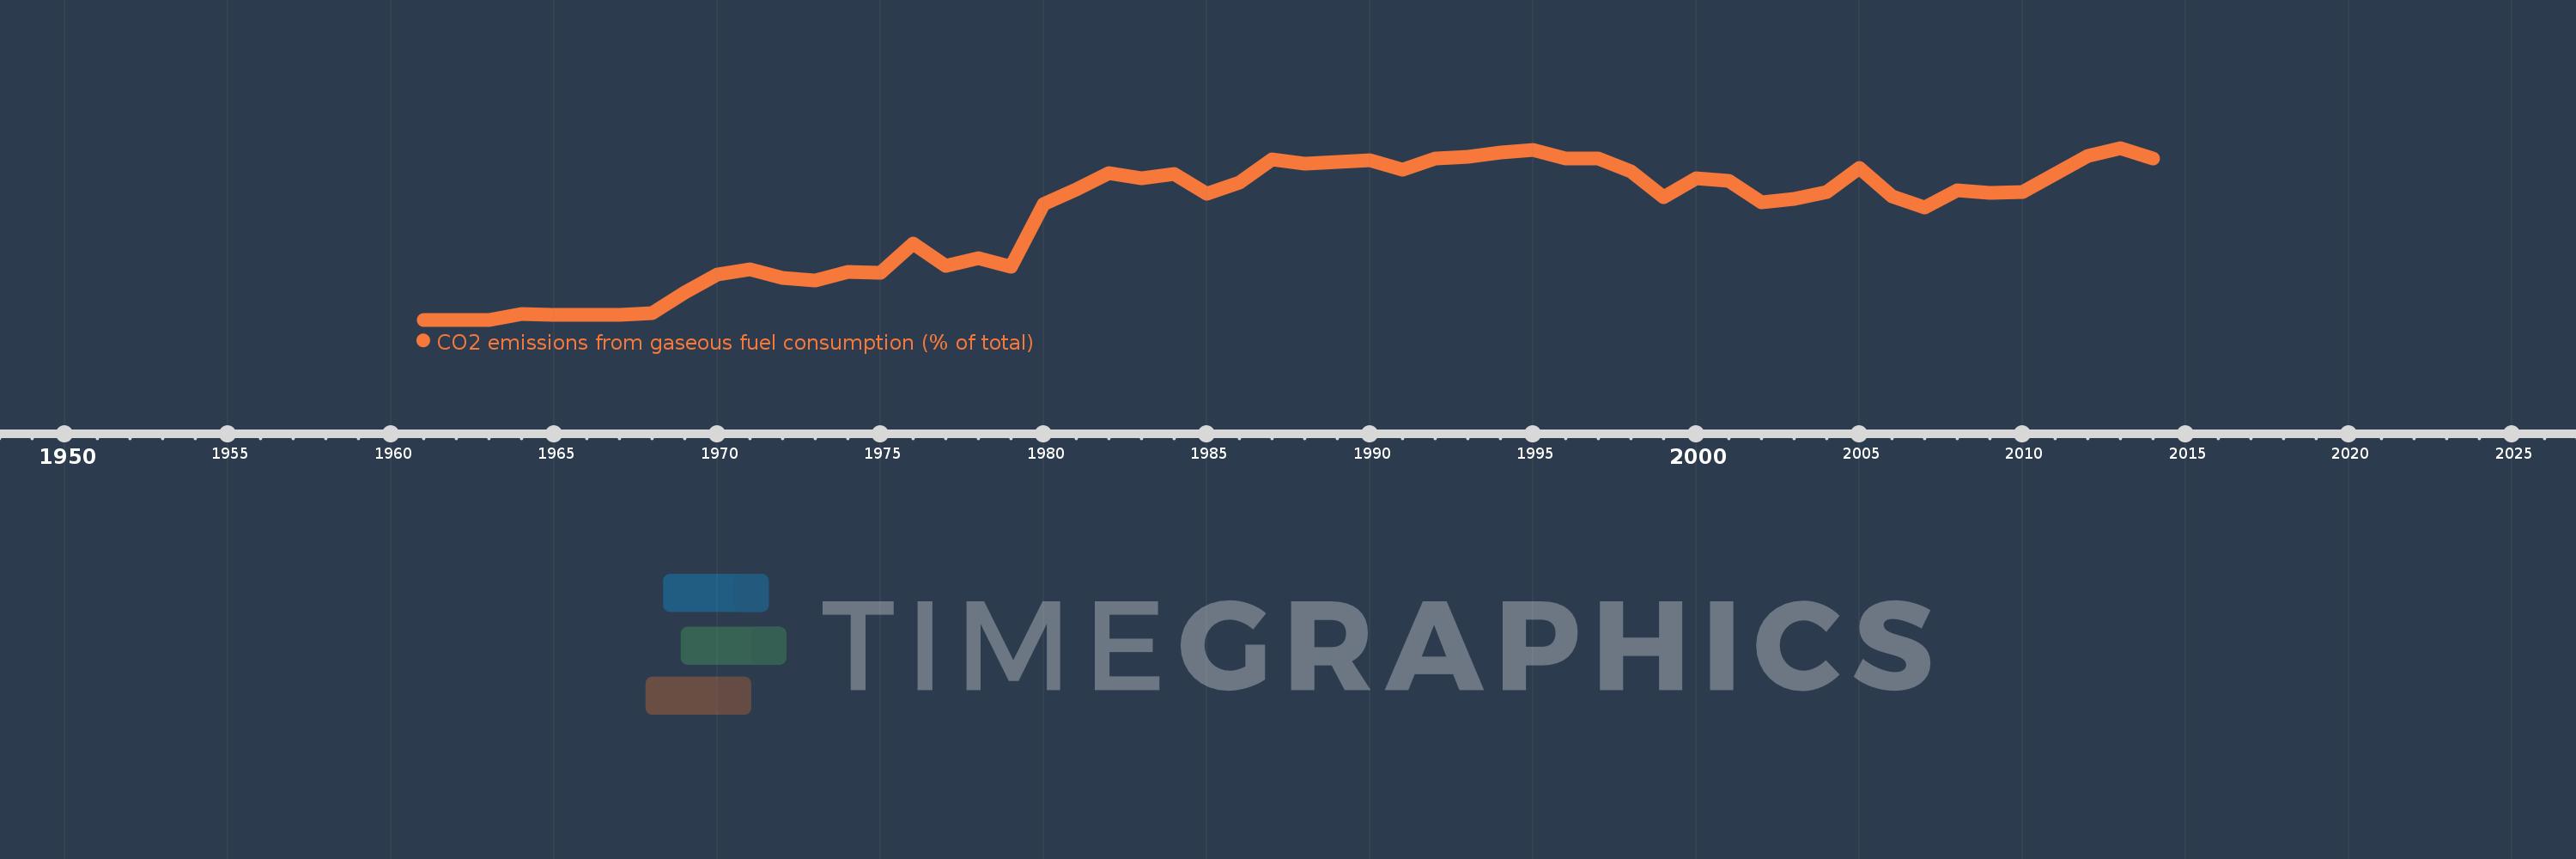
CO2 emissions from gaseous fuel consumption (% of total)
2014,2013,2012,2011,2010,2009,2008,2007,2006,2005,2004,2003,2002,2001,2000,1999,1998,1997,1996,1995,1994,1993,1992,1991,1990,1989,1988,1987,1986,1985,1984,1983,1982,1981,1980,1979,1978,1977,1976,1975,1974,1973,1972,1971,1970,1969,1968,1967,1966,1965,1964,1963,1962,1961
This statistics in other country:
AfghanistanAlbaniaAlgeriaAndorraAngolaAntigua and BarbudaArab WorldArgentinaArmeniaArubaAustraliaAustriaAzerbaijanBahamas, TheBahrainBangladeshBarbadosBelarusBelgiumBelizeBeninBermudaBhutanBoliviaBosnia and HerzegovinaBotswanaBrazilBritish Virgin IslandsBrunei DarussalamBulgariaBurkina FasoBurundiCabo VerdeCambodiaCameroonCanadaCaribbean small statesCayman IslandsCentral African RepublicCentral Europe and the BalticsChadChileChinaColombiaComorosCongo, Dem. Rep.Congo, Rep.Costa RicaCote d'IvoireCroatiaCubaCuracaoCyprusCzech RepublicDenmarkDjiboutiDominicaDominican RepublicEarly-demographic dividendEast Asia & PacificEast Asia & Pacific (excluding high income)East Asia & Pacific (IDA & IBRD countries)EcuadorEgypt, Arab Rep.El SalvadorEquatorial GuineaEritreaEstoniaEthiopiaEuro areaEurope & Central AsiaEurope & Central Asia (excluding high income)Europe & Central Asia (IDA & IBRD countries)European UnionFaroe IslandsFijiFinlandFragile and conflict affected situationsFranceFrench PolynesiaGabonGambia, TheGeorgiaGermanyGhanaGibraltarGreeceGreenlandGrenadaGuatemalaGuineaGuinea-BissauGuyanaHaitiHeavily indebted poor countries (HIPC)High incomeHondurasHong Kong SAR, ChinaHungaryIBRD onlyIcelandIDA & IBRD totalIDA blendIDA onlyIDA totalIndiaIndonesiaIran, Islamic Rep.IraqIrelandIsraelItalyJamaicaJapanJordanKazakhstanKenyaKiribatiKorea, Dem. People’s Rep.Korea, Rep.KuwaitKyrgyz RepublicLao PDRLate-demographic dividendLatin America & Caribbean Latin America & Caribbean (excluding high income)Latin America & the Caribbean (IDA & IBRD countries)LatviaLeast developed countries: UN classificationLebanonLesothoLiberiaLibyaLiechtensteinLithuaniaLow & middle incomeLow incomeLower middle incomeLuxembourgMacao SAR, ChinaMacedonia, FYRMadagascarMalawiMalaysiaMaldivesMaliMaltaMarshall IslandsMauritaniaMauritiusMexicoMicronesia, Fed. Sts.Middle East & North AfricaMiddle East & North Africa (excluding high income)Middle East & North Africa (IDA & IBRD countries)Middle incomeMoldovaMongoliaMontenegroMoroccoMozambiqueMyanmarNamibiaNauruNepalNetherlandsNew CaledoniaNew ZealandNicaraguaNigerNigeriaNorth AmericaNorwayOECD membersOmanOther small statesPacific island small statesPakistanPalauPanamaPapua New GuineaParaguayPeruPhilippinesPolandPortugalPost-demographic dividendPre-demographic dividendQatarRomaniaRussian FederationRwandaSamoaSao Tome and PrincipeSaudi ArabiaSenegalSerbiaSeychellesSierra LeoneSingaporeSint Maarten (Dutch part)Slovak RepublicSloveniaSmall statesSolomon IslandsSomaliaSouth AfricaSouth AsiaSouth Asia (IDA & IBRD)South SudanSpainSri LankaSt. Kitts and NevisSt. LuciaSt. Vincent and the GrenadinesSub-Saharan Africa Sub-Saharan Africa (excluding high income)Sub-Saharan Africa (IDA & IBRD countries)SudanSurinameSwazilandSwedenSwitzerlandSyrian Arab RepublicTajikistanTanzaniaThailandTimor-LesteTogoTongaTrinidad and TobagoTunisiaTurkeyTurkmenistanTurks and Caicos IslandsUgandaUkraineUnited Arab EmiratesUnited KingdomUnited StatesUpper middle incomeUruguayUzbekistanVanuatuVenezuela, RBVietnamWest Bank and GazaWorldYemen, Rep.ZambiaZimbabwe Timeline:
This timeline shows a graph from 1961 to 2014 of Qatar. No data until 1960. Number of actual observations by date: 54.
Source name:
World Development Indicators
Source organization:
Carbon Dioxide Information Analysis Center, Environmental Sciences Division, Oak Ridge National Laboratory, Tennessee, United States.
Categories, topics:
Energy & Mining, Climate Change, Environment
Last updated:
apr 23, 2017
Indicators value changes by year
Maximum:
86.836
jan 1, 2013
At the date of observation
Value
Absolute change
Change from previous value
jan 1, 1964
2.748
+2.748
%
jan 1, 1965
2.396
-0.352
-12.8%
jan 1, 1966
2.448
+0.051
2.14%
jan 1, 1967
2.512
+0.064
2.62%
jan 1, 1968
3.235
+0.723
28.78%
jan 1, 1969
13.931
+10.696
330.67%
jan 1, 1970
22.751
+8.82
63.31%
jan 1, 1971
25.436
+2.686
11.8%
jan 1, 1972
21.114
-4.322
-16.99%
jan 1, 1973
19.653
-1.461
-6.92%
jan 1, 1974
24.353
+4.7
23.91%
jan 1, 1975
23.811
-0.542
-2.22%
jan 1, 1976
38.722
+14.91
62.62%
jan 1, 1977
27.295
-11.426
-29.51%
jan 1, 1978
31.105
+3.809
13.96%
jan 1, 1979
26.915
-4.19
-13.47%
jan 1, 1980
58.35
+31.435
116.79%
jan 1, 1981
65.985
+7.635
13.08%
jan 1, 1982
74.28
+8.295
12.57%
jan 1, 1983
71.713
-2.567
-3.46%
jan 1, 1984
73.609
+1.896
2.64%
jan 1, 1985
63.604
-10.005
-13.59%
jan 1, 1986
69.465
+5.861
9.21%
jan 1, 1987
81.109
+11.644
16.76%
jan 1, 1988
78.954
-2.155
-2.66%
jan 1, 1989
79.865
+0.911
1.15%
jan 1, 1990
80.497
+0.632
0.79%
jan 1, 1991
75.646
-4.85
-6.03%
jan 1, 1992
81.411
+5.765
7.62%
jan 1, 1993
82.351
+0.94
1.15%
jan 1, 1994
84.412
+2.061
2.5%
jan 1, 1995
85.804
+1.393
1.65%
jan 1, 1996
81.578
-4.226
-4.93%
jan 1, 1997
81.483
-0.095
-0.12%
jan 1, 1998
74.993
-6.49
-7.96%
jan 1, 1999
61.838
-13.155
-17.54%
jan 1, 2000
71.325
+9.487
15.34%
jan 1, 2001
69.993
-1.333
-1.87%
jan 1, 2002
59.492
-10.501
-15.0%
jan 1, 2003
61.147
+1.656
2.78%
jan 1, 2004
64.577
+3.429
5.61%
jan 1, 2005
76.526
+11.95
18.5%
jan 1, 2006
62.486
-14.041
-18.35%
jan 1, 2007
56.898
-5.588
-8.94%
jan 1, 2008
65.589
+8.691
15.27%
jan 1, 2009
64.152
-1.437
-2.19%
jan 1, 2010
64.671
+0.519
0.81%
jan 1, 2011
73.59
+8.919
13.79%
jan 1, 2012
82.968
+9.378
12.74%
jan 1, 2013
86.836
+3.868
4.66%
jan 1, 2014
81.321
-5.515
-6.35%
Ranking of countries by current statistics by years


Comments: