29
/
en
AIzaSyAYiBZKx7MnpbEhh9jyipgxe19OcubqV5w
April 1, 2024
32443
Europe & Central Asia (IDA & IBRD countries)
TEC
false
2
1
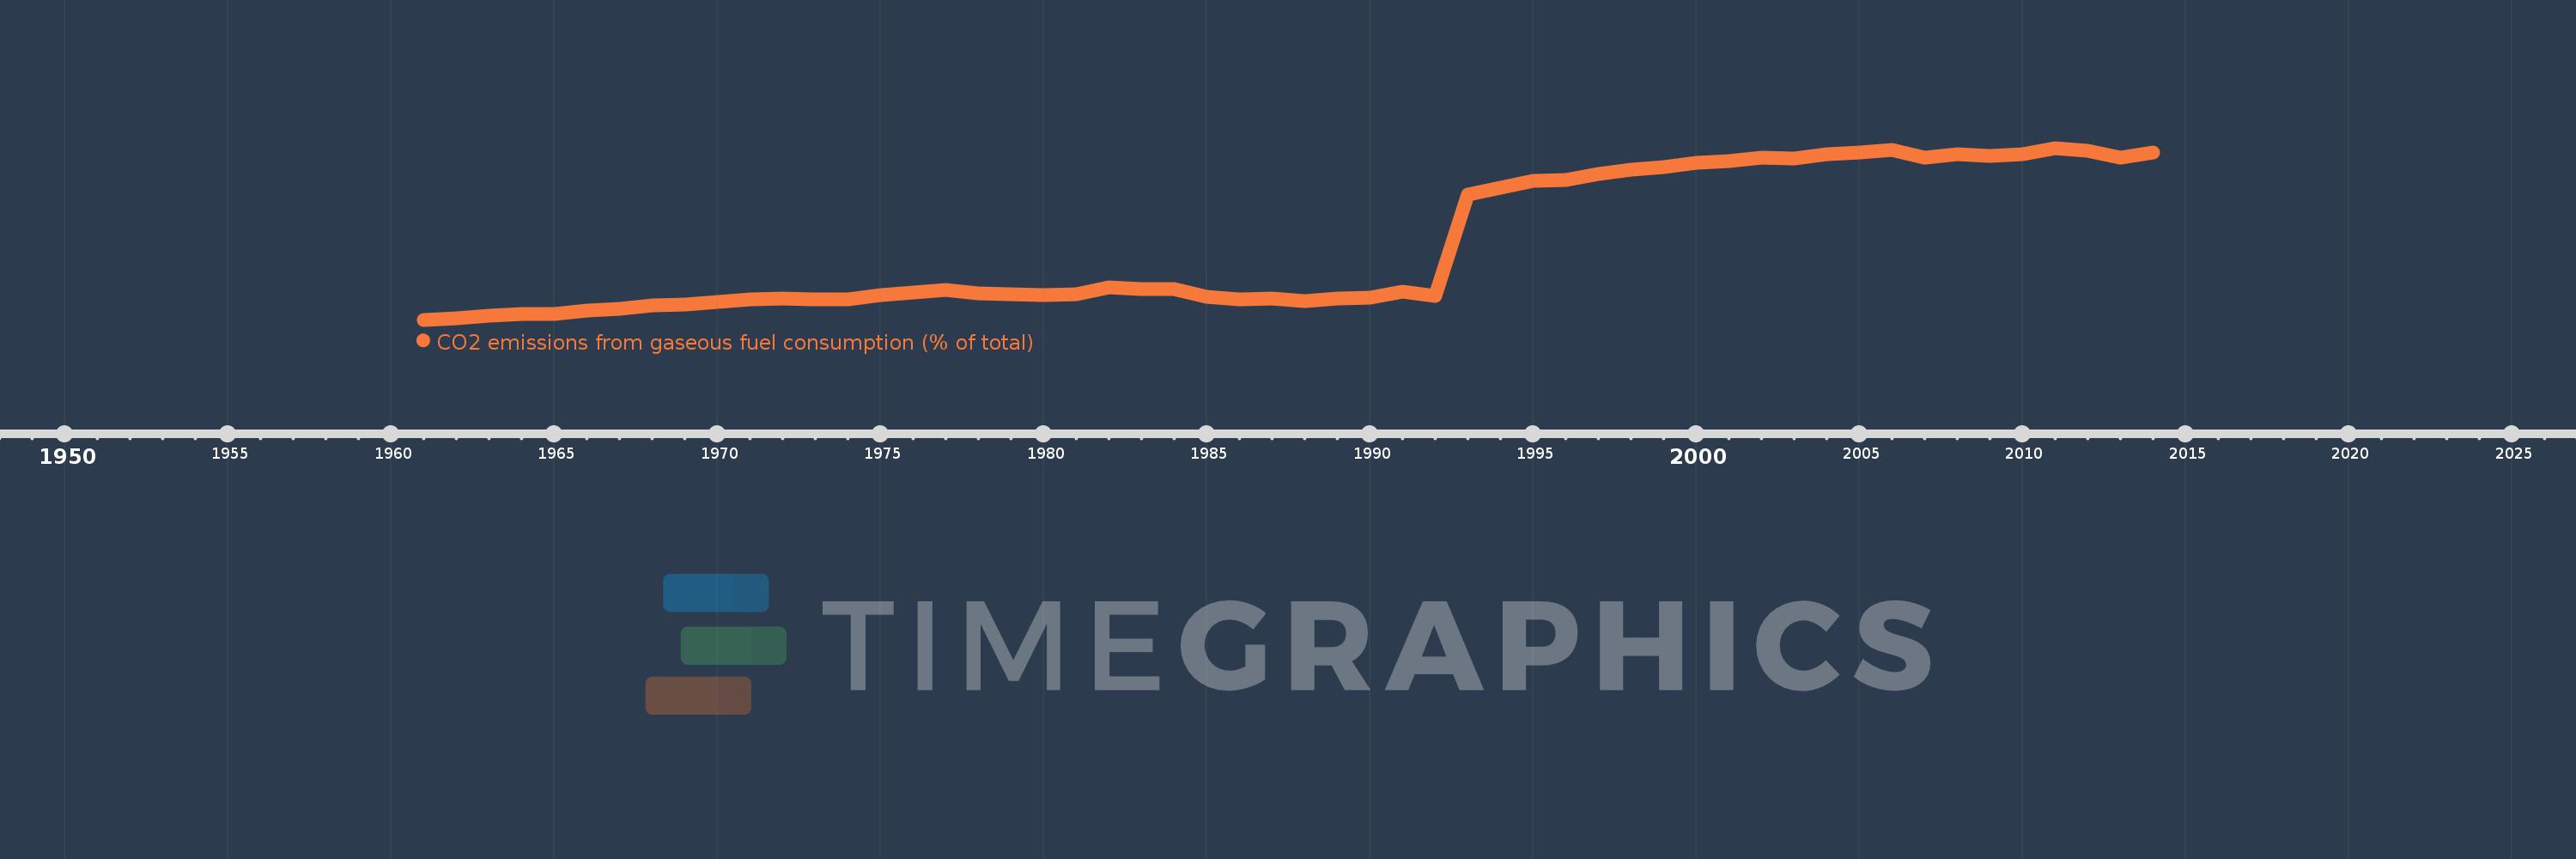
CO2 emissions from gaseous fuel consumption (% of total)
2014,2013,2012,2011,2010,2009,2008,2007,2006,2005,2004,2003,2002,2001,2000,1999,1998,1997,1996,1995,1994,1993,1992,1991,1990,1989,1988,1987,1986,1985,1984,1983,1982,1981,1980,1979,1978,1977,1976,1975,1974,1973,1972,1971,1970,1969,1968,1967,1966,1965,1964,1963,1962,1961
This statistics in other country:
AfghanistanAlbaniaAlgeriaAndorraAngolaAntigua and BarbudaArab WorldArgentinaArmeniaArubaAustraliaAustriaAzerbaijanBahamas, TheBahrainBangladeshBarbadosBelarusBelgiumBelizeBeninBermudaBhutanBoliviaBosnia and HerzegovinaBotswanaBrazilBritish Virgin IslandsBrunei DarussalamBulgariaBurkina FasoBurundiCabo VerdeCambodiaCameroonCanadaCaribbean small statesCayman IslandsCentral African RepublicCentral Europe and the BalticsChadChileChinaColombiaComorosCongo, Dem. Rep.Congo, Rep.Costa RicaCote d'IvoireCroatiaCubaCuracaoCyprusCzech RepublicDenmarkDjiboutiDominicaDominican RepublicEarly-demographic dividendEast Asia & PacificEast Asia & Pacific (excluding high income)East Asia & Pacific (IDA & IBRD countries)EcuadorEgypt, Arab Rep.El SalvadorEquatorial GuineaEritreaEstoniaEthiopiaEuro areaEurope & Central AsiaEurope & Central Asia (excluding high income)Europe & Central Asia (IDA & IBRD countries)European UnionFaroe IslandsFijiFinlandFragile and conflict affected situationsFranceFrench PolynesiaGabonGambia, TheGeorgiaGermanyGhanaGibraltarGreeceGreenlandGrenadaGuatemalaGuineaGuinea-BissauGuyanaHaitiHeavily indebted poor countries (HIPC)High incomeHondurasHong Kong SAR, ChinaHungaryIBRD onlyIcelandIDA & IBRD totalIDA blendIDA onlyIDA totalIndiaIndonesiaIran, Islamic Rep.IraqIrelandIsraelItalyJamaicaJapanJordanKazakhstanKenyaKiribatiKorea, Dem. People’s Rep.Korea, Rep.KuwaitKyrgyz RepublicLao PDRLate-demographic dividendLatin America & Caribbean Latin America & Caribbean (excluding high income)Latin America & the Caribbean (IDA & IBRD countries)LatviaLeast developed countries: UN classificationLebanonLesothoLiberiaLibyaLiechtensteinLithuaniaLow & middle incomeLow incomeLower middle incomeLuxembourgMacao SAR, ChinaMacedonia, FYRMadagascarMalawiMalaysiaMaldivesMaliMaltaMarshall IslandsMauritaniaMauritiusMexicoMicronesia, Fed. Sts.Middle East & North AfricaMiddle East & North Africa (excluding high income)Middle East & North Africa (IDA & IBRD countries)Middle incomeMoldovaMongoliaMontenegroMoroccoMozambiqueMyanmarNamibiaNauruNepalNetherlandsNew CaledoniaNew ZealandNicaraguaNigerNigeriaNorth AmericaNorwayOECD membersOmanOther small statesPacific island small statesPakistanPalauPanamaPapua New GuineaParaguayPeruPhilippinesPolandPortugalPost-demographic dividendPre-demographic dividendQatarRomaniaRussian FederationRwandaSamoaSao Tome and PrincipeSaudi ArabiaSenegalSerbiaSeychellesSierra LeoneSingaporeSint Maarten (Dutch part)Slovak RepublicSloveniaSmall statesSolomon IslandsSomaliaSouth AfricaSouth AsiaSouth Asia (IDA & IBRD)South SudanSpainSri LankaSt. Kitts and NevisSt. LuciaSt. Vincent and the GrenadinesSub-Saharan Africa Sub-Saharan Africa (excluding high income)Sub-Saharan Africa (IDA & IBRD countries)SudanSurinameSwazilandSwedenSwitzerlandSyrian Arab RepublicTajikistanTanzaniaThailandTimor-LesteTogoTongaTrinidad and TobagoTunisiaTurkeyTurkmenistanTurks and Caicos IslandsUgandaUkraineUnited Arab EmiratesUnited KingdomUnited StatesUpper middle incomeUruguayUzbekistanVanuatuVenezuela, RBVietnamWest Bank and GazaWorldYemen, Rep.ZambiaZimbabwe Timeline:
This timeline shows a graph from 1961 to 2014 of Europe & Central Asia (IDA & IBRD countries). No data until 1960. Number of actual observations by date: 54.
Source name:
World Development Indicators
Source organization:
Carbon Dioxide Information Analysis Center, Environmental Sciences Division, Oak Ridge National Laboratory, Tennessee, United States.
Categories, topics:
Energy & Mining, Climate Change, Environment
Last updated:
apr 23, 2017
Indicators value changes by year
Maximum:
42.038
jan 1, 2011
At the date of observation
Value
Absolute change
Change from previous value
jan 1, 1961
7.329
+7.329
0.0%
jan 1, 1962
7.608
+0.279
3.8%
jan 1, 1963
8.223
+0.615
8.09%
jan 1, 1964
8.457
+0.233
2.84%
jan 1, 1965
8.527
+0.07
0.83%
jan 1, 1966
9.178
+0.651
7.63%
jan 1, 1967
9.553
+0.376
4.09%
jan 1, 1968
10.176
+0.622
6.51%
jan 1, 1969
10.366
+0.19
1.87%
jan 1, 1970
10.865
+0.5
4.82%
jan 1, 1971
11.504
+0.638
5.88%
jan 1, 1972
11.661
+0.157
1.36%
jan 1, 1973
11.392
-0.269
-2.31%
jan 1, 1974
11.497
+0.105
0.92%
jan 1, 1975
12.297
+0.8
6.96%
jan 1, 1976
12.822
+0.524
4.26%
jan 1, 1977
13.397
+0.576
4.49%
jan 1, 1978
12.68
-0.717
-5.36%
jan 1, 1979
12.522
-0.157
-1.24%
jan 1, 1980
12.279
-0.244
-1.95%
jan 1, 1981
12.547
+0.268
2.18%
jan 1, 1982
13.795
+1.248
9.95%
jan 1, 1983
13.53
-0.265
-1.92%
jan 1, 1984
13.466
-0.064
-0.47%
jan 1, 1985
12.036
-1.43
-10.62%
jan 1, 1986
11.432
-0.603
-5.01%
jan 1, 1987
11.608
+0.175
1.53%
jan 1, 1988
11.138
-0.47
-4.05%
jan 1, 1989
11.617
+0.48
4.31%
jan 1, 1990
11.814
+0.196
1.69%
jan 1, 1991
12.972
+1.159
9.81%
jan 1, 1992
12.159
-0.814
-6.27%
jan 1, 1993
32.534
+20.376
167.58%
jan 1, 1994
33.95
+1.415
4.35%
jan 1, 1995
35.474
+1.524
4.49%
jan 1, 1996
35.599
+0.125
0.35%
jan 1, 1997
36.721
+1.122
3.15%
jan 1, 1998
37.575
+0.854
2.33%
jan 1, 1999
38.136
+0.561
1.49%
jan 1, 2000
38.98
+0.843
2.21%
jan 1, 2001
39.319
+0.34
0.87%
jan 1, 2002
40.105
+0.786
2.0%
jan 1, 2003
39.933
-0.171
-0.43%
jan 1, 2004
40.698
+0.765
1.92%
jan 1, 2005
41.06
+0.361
0.89%
jan 1, 2006
41.585
+0.525
1.28%
jan 1, 2007
40.081
-1.504
-3.62%
jan 1, 2008
40.688
+0.607
1.51%
jan 1, 2009
40.451
-0.237
-0.58%
jan 1, 2010
40.828
+0.378
0.93%
jan 1, 2011
42.038
+1.21
2.96%
jan 1, 2012
41.524
-0.514
-1.22%
jan 1, 2013
40.103
-1.421
-3.42%
jan 1, 2014
41.108
+1.005
2.51%
Ranking of countries by current statistics by years


Comments: