29
/
en
AIzaSyAYiBZKx7MnpbEhh9jyipgxe19OcubqV5w
April 1, 2024
42169
Latin America & Caribbean (excluding high income)
LAC
false
2
1
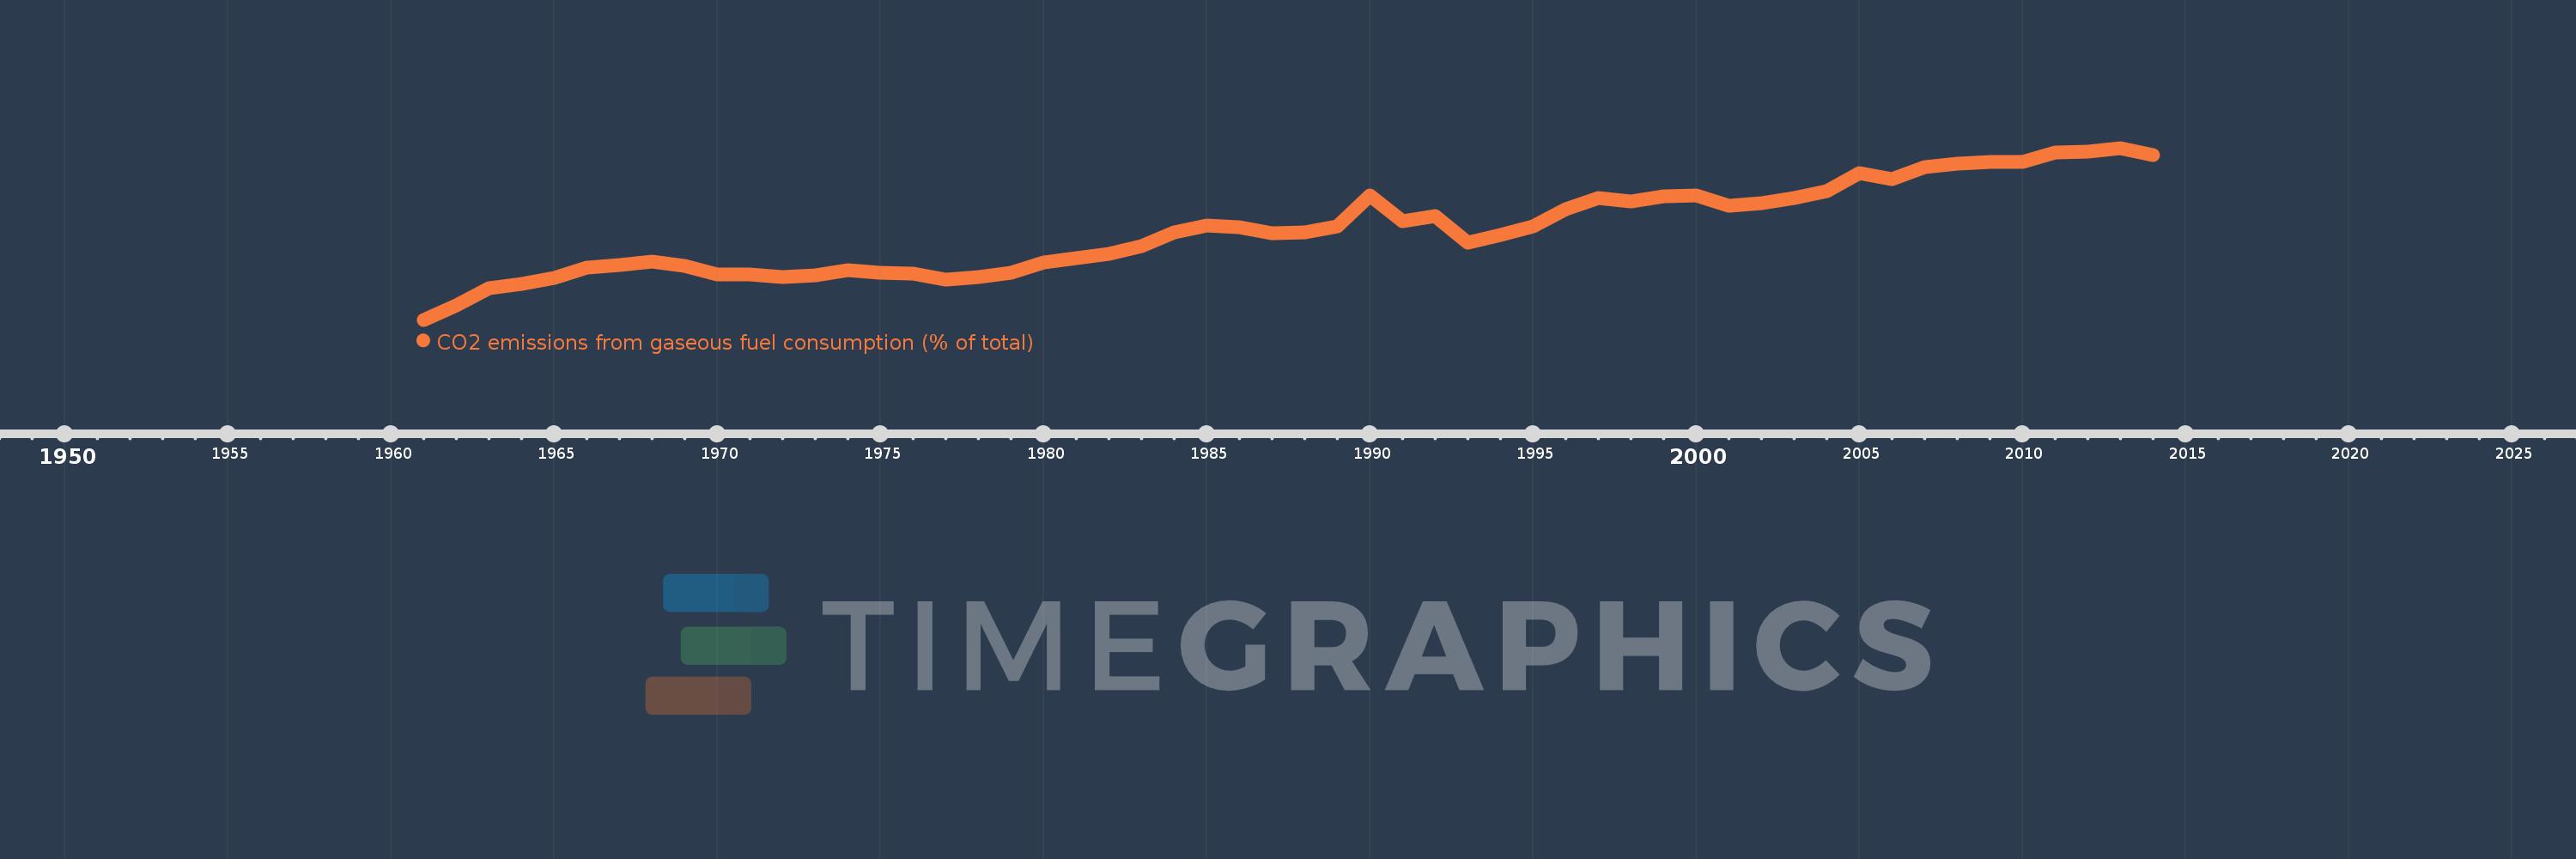
CO2 emissions from gaseous fuel consumption (% of total)
2014,2013,2012,2011,2010,2009,2008,2007,2006,2005,2004,2003,2002,2001,2000,1999,1998,1997,1996,1995,1994,1993,1992,1991,1990,1989,1988,1987,1986,1985,1984,1983,1982,1981,1980,1979,1978,1977,1976,1975,1974,1973,1972,1971,1970,1969,1968,1967,1966,1965,1964,1963,1962,1961
This statistics in other country:
AfghanistanAlbaniaAlgeriaAndorraAngolaAntigua and BarbudaArab WorldArgentinaArmeniaArubaAustraliaAustriaAzerbaijanBahamas, TheBahrainBangladeshBarbadosBelarusBelgiumBelizeBeninBermudaBhutanBoliviaBosnia and HerzegovinaBotswanaBrazilBritish Virgin IslandsBrunei DarussalamBulgariaBurkina FasoBurundiCabo VerdeCambodiaCameroonCanadaCaribbean small statesCayman IslandsCentral African RepublicCentral Europe and the BalticsChadChileChinaColombiaComorosCongo, Dem. Rep.Congo, Rep.Costa RicaCote d'IvoireCroatiaCubaCuracaoCyprusCzech RepublicDenmarkDjiboutiDominicaDominican RepublicEarly-demographic dividendEast Asia & PacificEast Asia & Pacific (excluding high income)East Asia & Pacific (IDA & IBRD countries)EcuadorEgypt, Arab Rep.El SalvadorEquatorial GuineaEritreaEstoniaEthiopiaEuro areaEurope & Central AsiaEurope & Central Asia (excluding high income)Europe & Central Asia (IDA & IBRD countries)European UnionFaroe IslandsFijiFinlandFragile and conflict affected situationsFranceFrench PolynesiaGabonGambia, TheGeorgiaGermanyGhanaGibraltarGreeceGreenlandGrenadaGuatemalaGuineaGuinea-BissauGuyanaHaitiHeavily indebted poor countries (HIPC)High incomeHondurasHong Kong SAR, ChinaHungaryIBRD onlyIcelandIDA & IBRD totalIDA blendIDA onlyIDA totalIndiaIndonesiaIran, Islamic Rep.IraqIrelandIsraelItalyJamaicaJapanJordanKazakhstanKenyaKiribatiKorea, Dem. People’s Rep.Korea, Rep.KuwaitKyrgyz RepublicLao PDRLate-demographic dividendLatin America & Caribbean Latin America & Caribbean (excluding high income)Latin America & the Caribbean (IDA & IBRD countries)LatviaLeast developed countries: UN classificationLebanonLesothoLiberiaLibyaLiechtensteinLithuaniaLow & middle incomeLow incomeLower middle incomeLuxembourgMacao SAR, ChinaMacedonia, FYRMadagascarMalawiMalaysiaMaldivesMaliMaltaMarshall IslandsMauritaniaMauritiusMexicoMicronesia, Fed. Sts.Middle East & North AfricaMiddle East & North Africa (excluding high income)Middle East & North Africa (IDA & IBRD countries)Middle incomeMoldovaMongoliaMontenegroMoroccoMozambiqueMyanmarNamibiaNauruNepalNetherlandsNew CaledoniaNew ZealandNicaraguaNigerNigeriaNorth AmericaNorwayOECD membersOmanOther small statesPacific island small statesPakistanPalauPanamaPapua New GuineaParaguayPeruPhilippinesPolandPortugalPost-demographic dividendPre-demographic dividendQatarRomaniaRussian FederationRwandaSamoaSao Tome and PrincipeSaudi ArabiaSenegalSerbiaSeychellesSierra LeoneSingaporeSint Maarten (Dutch part)Slovak RepublicSloveniaSmall statesSolomon IslandsSomaliaSouth AfricaSouth AsiaSouth Asia (IDA & IBRD)South SudanSpainSri LankaSt. Kitts and NevisSt. LuciaSt. Vincent and the GrenadinesSub-Saharan Africa Sub-Saharan Africa (excluding high income)Sub-Saharan Africa (IDA & IBRD countries)SudanSurinameSwazilandSwedenSwitzerlandSyrian Arab RepublicTajikistanTanzaniaThailandTimor-LesteTogoTongaTrinidad and TobagoTunisiaTurkeyTurkmenistanTurks and Caicos IslandsUgandaUkraineUnited Arab EmiratesUnited KingdomUnited StatesUpper middle incomeUruguayUzbekistanVanuatuVenezuela, RBVietnamWest Bank and GazaWorldYemen, Rep.ZambiaZimbabwe Timeline:
This timeline shows a graph from 1961 to 2014 of Latin America & Caribbean (excluding high income). No data until 1960. Number of actual observations by date: 54.
Source name:
World Development Indicators
Source organization:
Carbon Dioxide Information Analysis Center, Environmental Sciences Division, Oak Ridge National Laboratory, Tennessee, United States.
Categories, topics:
Energy & Mining, Climate Change, Environment
Last updated:
apr 23, 2017
Indicators value changes by year
Maximum:
23.968
jan 1, 2013
At the date of observation
Value
Absolute change
Change from previous value
jan 1, 1961
7.221
+7.221
0.0%
jan 1, 1962
8.626
+1.405
19.46%
jan 1, 1963
10.303
+1.677
19.45%
jan 1, 1964
10.706
+0.402
3.91%
jan 1, 1965
11.285
+0.579
5.41%
jan 1, 1966
12.275
+0.99
8.77%
jan 1, 1967
12.53
+0.255
2.08%
jan 1, 1968
12.908
+0.378
3.02%
jan 1, 1969
12.504
-0.404
-3.13%
jan 1, 1970
11.674
-0.83
-6.63%
jan 1, 1971
11.625
-0.05
-0.43%
jan 1, 1972
11.393
-0.232
-1.99%
jan 1, 1973
11.566
+0.172
1.51%
jan 1, 1974
12.04
+0.475
4.1%
jan 1, 1975
11.783
-0.257
-2.13%
jan 1, 1976
11.688
-0.095
-0.81%
jan 1, 1977
11.097
-0.591
-5.06%
jan 1, 1978
11.405
+0.308
2.77%
jan 1, 1979
11.776
+0.371
3.25%
jan 1, 1980
12.767
+0.991
8.42%
jan 1, 1981
13.184
+0.416
3.26%
jan 1, 1982
13.685
+0.502
3.81%
jan 1, 1983
14.431
+0.745
5.44%
jan 1, 1984
15.725
+1.295
8.97%
jan 1, 1985
16.384
+0.658
4.19%
jan 1, 1986
16.206
-0.178
-1.09%
jan 1, 1987
15.678
-0.527
-3.25%
jan 1, 1988
15.721
+0.043
0.27%
jan 1, 1989
16.312
+0.59
3.76%
jan 1, 1990
19.296
+2.984
18.29%
jan 1, 1991
16.841
-2.455
-12.72%
jan 1, 1992
17.295
+0.455
2.7%
jan 1, 1993
14.739
-2.556
-14.78%
jan 1, 1994
15.463
+0.724
4.91%
jan 1, 1995
16.345
+0.882
5.7%
jan 1, 1996
18.035
+1.691
10.34%
jan 1, 1997
19.092
+1.057
5.86%
jan 1, 1998
18.755
-0.337
-1.77%
jan 1, 1999
19.288
+0.533
2.84%
jan 1, 2000
19.339
+0.051
0.27%
jan 1, 2001
18.363
-0.976
-5.05%
jan 1, 2002
18.618
+0.255
1.39%
jan 1, 2003
19.063
+0.445
2.39%
jan 1, 2004
19.753
+0.69
3.62%
jan 1, 2005
21.542
+1.789
9.06%
jan 1, 2006
20.894
-0.648
-3.01%
jan 1, 2007
22.098
+1.204
5.76%
jan 1, 2008
22.445
+0.347
1.57%
jan 1, 2009
22.603
+0.158
0.7%
jan 1, 2010
22.564
-0.04
-0.18%
jan 1, 2011
23.511
+0.947
4.2%
jan 1, 2012
23.61
+0.099
0.42%
jan 1, 2013
23.968
+0.358
1.52%
jan 1, 2014
23.306
-0.662
-2.76%
Ranking of countries by current statistics by years


Comments: