29
/
en
AIzaSyAYiBZKx7MnpbEhh9jyipgxe19OcubqV5w
April 1, 2024
214112
Norway
NOR
true
2
1
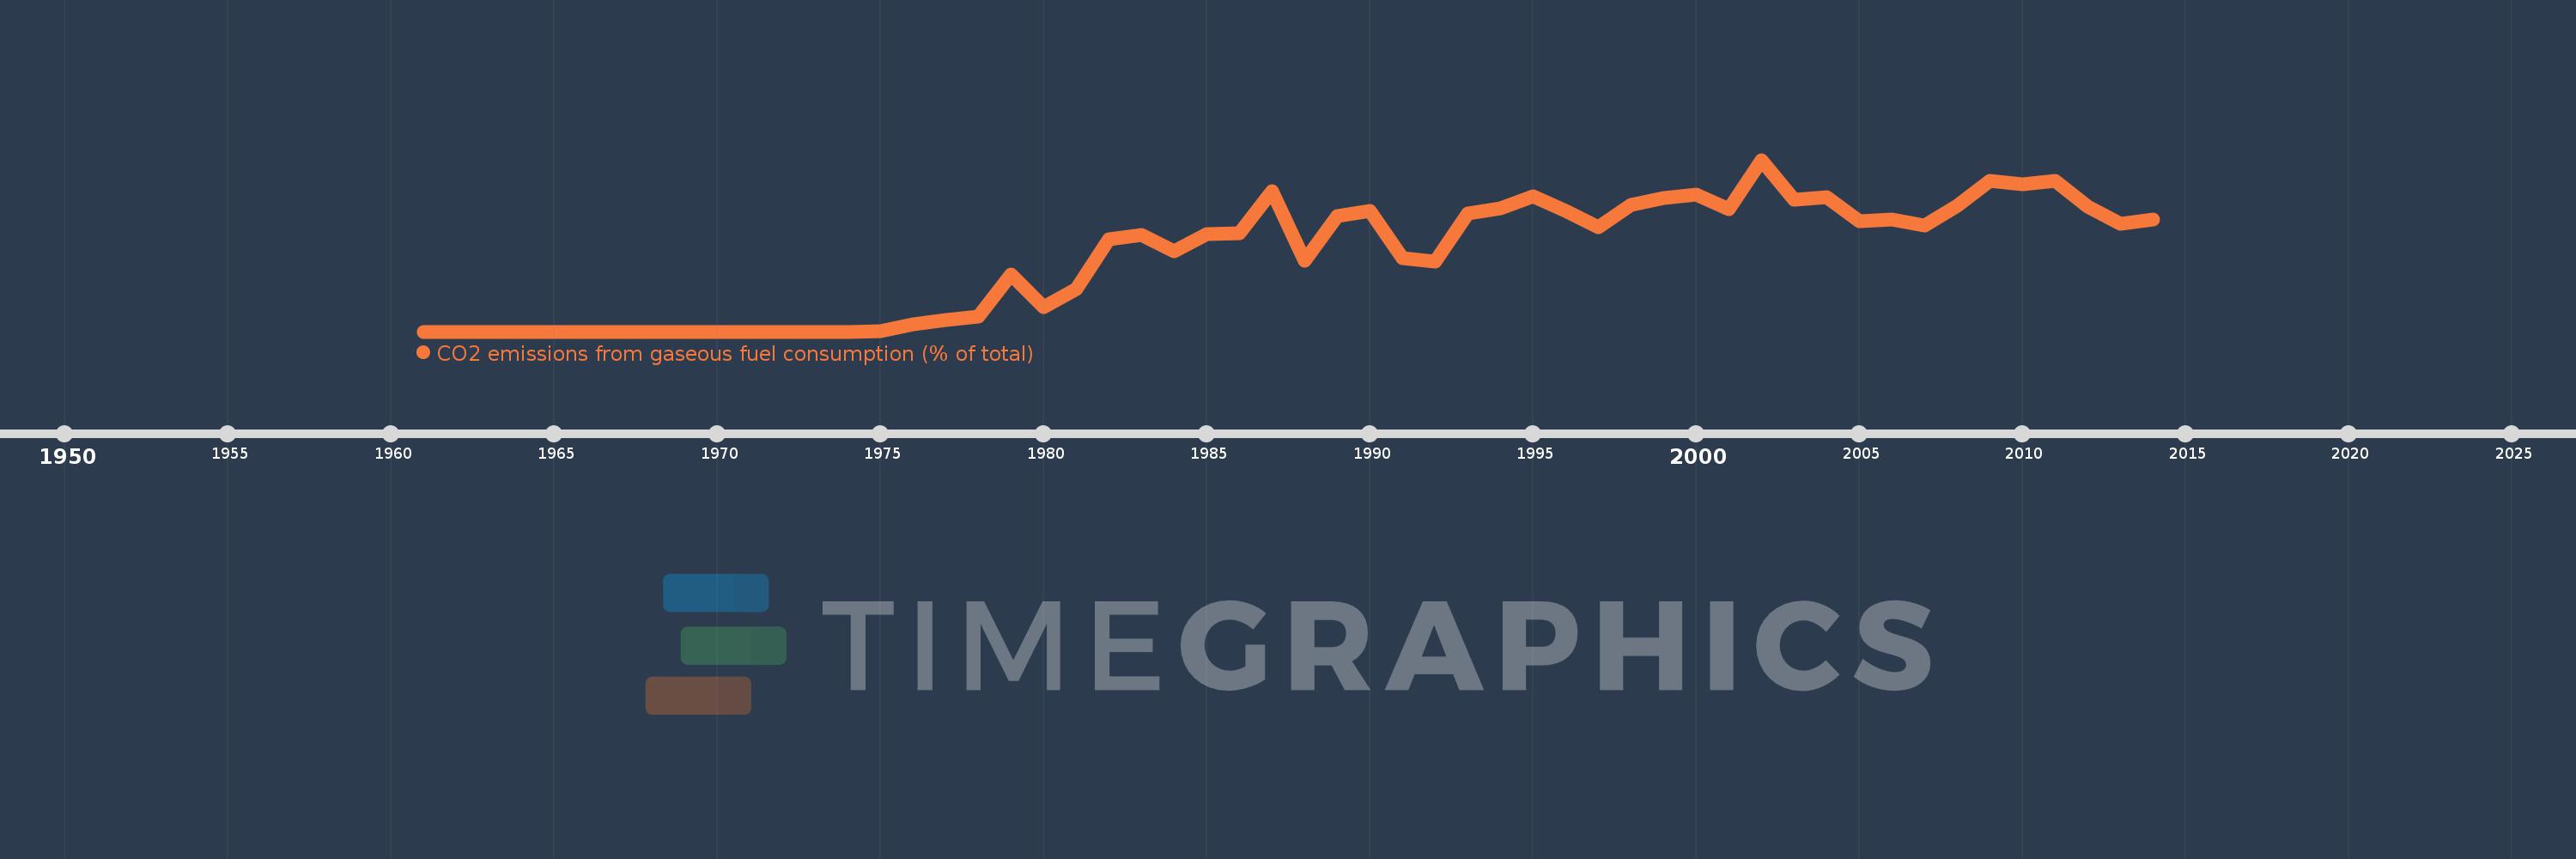
CO2 emissions from gaseous fuel consumption (% of total)
2014,2013,2012,2011,2010,2009,2008,2007,2006,2005,2004,2003,2002,2001,2000,1999,1998,1997,1996,1995,1994,1993,1992,1991,1990,1989,1988,1987,1986,1985,1984,1983,1982,1981,1980,1979,1978,1977,1976,1975,1974,1973,1972,1971,1970,1969,1968,1967,1966,1965,1964,1963,1962,1961
This statistics in other country:
AfghanistanAlbaniaAlgeriaAndorraAngolaAntigua and BarbudaArab WorldArgentinaArmeniaArubaAustraliaAustriaAzerbaijanBahamas, TheBahrainBangladeshBarbadosBelarusBelgiumBelizeBeninBermudaBhutanBoliviaBosnia and HerzegovinaBotswanaBrazilBritish Virgin IslandsBrunei DarussalamBulgariaBurkina FasoBurundiCabo VerdeCambodiaCameroonCanadaCaribbean small statesCayman IslandsCentral African RepublicCentral Europe and the BalticsChadChileChinaColombiaComorosCongo, Dem. Rep.Congo, Rep.Costa RicaCote d'IvoireCroatiaCubaCuracaoCyprusCzech RepublicDenmarkDjiboutiDominicaDominican RepublicEarly-demographic dividendEast Asia & PacificEast Asia & Pacific (excluding high income)East Asia & Pacific (IDA & IBRD countries)EcuadorEgypt, Arab Rep.El SalvadorEquatorial GuineaEritreaEstoniaEthiopiaEuro areaEurope & Central AsiaEurope & Central Asia (excluding high income)Europe & Central Asia (IDA & IBRD countries)European UnionFaroe IslandsFijiFinlandFragile and conflict affected situationsFranceFrench PolynesiaGabonGambia, TheGeorgiaGermanyGhanaGibraltarGreeceGreenlandGrenadaGuatemalaGuineaGuinea-BissauGuyanaHaitiHeavily indebted poor countries (HIPC)High incomeHondurasHong Kong SAR, ChinaHungaryIBRD onlyIcelandIDA & IBRD totalIDA blendIDA onlyIDA totalIndiaIndonesiaIran, Islamic Rep.IraqIrelandIsraelItalyJamaicaJapanJordanKazakhstanKenyaKiribatiKorea, Dem. People’s Rep.Korea, Rep.KuwaitKyrgyz RepublicLao PDRLate-demographic dividendLatin America & Caribbean Latin America & Caribbean (excluding high income)Latin America & the Caribbean (IDA & IBRD countries)LatviaLeast developed countries: UN classificationLebanonLesothoLiberiaLibyaLiechtensteinLithuaniaLow & middle incomeLow incomeLower middle incomeLuxembourgMacao SAR, ChinaMacedonia, FYRMadagascarMalawiMalaysiaMaldivesMaliMaltaMarshall IslandsMauritaniaMauritiusMexicoMicronesia, Fed. Sts.Middle East & North AfricaMiddle East & North Africa (excluding high income)Middle East & North Africa (IDA & IBRD countries)Middle incomeMoldovaMongoliaMontenegroMoroccoMozambiqueMyanmarNamibiaNauruNepalNetherlandsNew CaledoniaNew ZealandNicaraguaNigerNigeriaNorth AmericaNorwayOECD membersOmanOther small statesPacific island small statesPakistanPalauPanamaPapua New GuineaParaguayPeruPhilippinesPolandPortugalPost-demographic dividendPre-demographic dividendQatarRomaniaRussian FederationRwandaSamoaSao Tome and PrincipeSaudi ArabiaSenegalSerbiaSeychellesSierra LeoneSingaporeSint Maarten (Dutch part)Slovak RepublicSloveniaSmall statesSolomon IslandsSomaliaSouth AfricaSouth AsiaSouth Asia (IDA & IBRD)South SudanSpainSri LankaSt. Kitts and NevisSt. LuciaSt. Vincent and the GrenadinesSub-Saharan Africa Sub-Saharan Africa (excluding high income)Sub-Saharan Africa (IDA & IBRD countries)SudanSurinameSwazilandSwedenSwitzerlandSyrian Arab RepublicTajikistanTanzaniaThailandTimor-LesteTogoTongaTrinidad and TobagoTunisiaTurkeyTurkmenistanTurks and Caicos IslandsUgandaUkraineUnited Arab EmiratesUnited KingdomUnited StatesUpper middle incomeUruguayUzbekistanVanuatuVenezuela, RBVietnamWest Bank and GazaWorldYemen, Rep.ZambiaZimbabwe Timeline:
This timeline shows a graph from 1961 to 2014 of Norway. No data until 1960. Number of actual observations by date: 54.
Source name:
World Development Indicators
Source organization:
Carbon Dioxide Information Analysis Center, Environmental Sciences Division, Oak Ridge National Laboratory, Tennessee, United States.
Categories, topics:
Energy & Mining, Climate Change, Environment
Last updated:
apr 23, 2017
Indicators value changes by year
Maximum:
33.669
jan 1, 2002
At the date of observation
Value
Absolute change
Change from previous value
jan 1, 1975
0.106
+0.106
%
jan 1, 1976
1.347
+1.241
1.17K%
jan 1, 1977
2.276
+0.929
69.0%
jan 1, 1978
3.021
+0.745
32.72%
jan 1, 1979
11.151
+8.13
269.07%
jan 1, 1980
4.733
-6.418
-57.55%
jan 1, 1981
8.394
+3.66
77.33%
jan 1, 1982
18.131
+9.737
116.01%
jan 1, 1983
18.982
+0.851
4.69%
jan 1, 1984
15.764
-3.218
-16.95%
jan 1, 1985
19.17
+3.406
21.61%
jan 1, 1986
19.247
+0.077
0.4%
jan 1, 1987
27.528
+8.281
43.02%
jan 1, 1988
13.945
-13.583
-49.34%
jan 1, 1989
22.685
+8.74
62.67%
jan 1, 1990
23.697
+1.012
4.46%
jan 1, 1991
14.361
-9.336
-39.4%
jan 1, 1992
13.799
-0.562
-3.91%
jan 1, 1993
23.164
+9.365
67.87%
jan 1, 1994
24.079
+0.915
3.95%
jan 1, 1995
26.53
+2.451
10.18%
jan 1, 1996
23.709
-2.822
-10.64%
jan 1, 1997
20.486
-3.223
-13.59%
jan 1, 1998
24.876
+4.39
21.43%
jan 1, 1999
26.111
+1.236
4.97%
jan 1, 2000
26.78
+0.669
2.56%
jan 1, 2001
23.93
-2.85
-10.64%
jan 1, 2002
33.669
+9.739
40.7%
jan 1, 2003
25.846
-7.822
-23.23%
jan 1, 2004
26.289
+0.443
1.71%
jan 1, 2005
21.711
-4.578
-17.41%
jan 1, 2006
21.974
+0.262
1.21%
jan 1, 2007
20.822
-1.152
-5.24%
jan 1, 2008
24.723
+3.902
18.74%
jan 1, 2009
29.565
+4.841
19.58%
jan 1, 2010
28.835
-0.73
-2.47%
jan 1, 2011
29.543
+0.709
2.46%
jan 1, 2012
24.519
-5.024
-17.01%
jan 1, 2013
21.11
-3.409
-13.9%
jan 1, 2014
22.025
+0.916
4.34%
Ranking of countries by current statistics by years


Comments: