29
/
en
AIzaSyAYiBZKx7MnpbEhh9jyipgxe19OcubqV5w
April 1, 2024
280725
Venezuela, RB
VEN
true
2
1
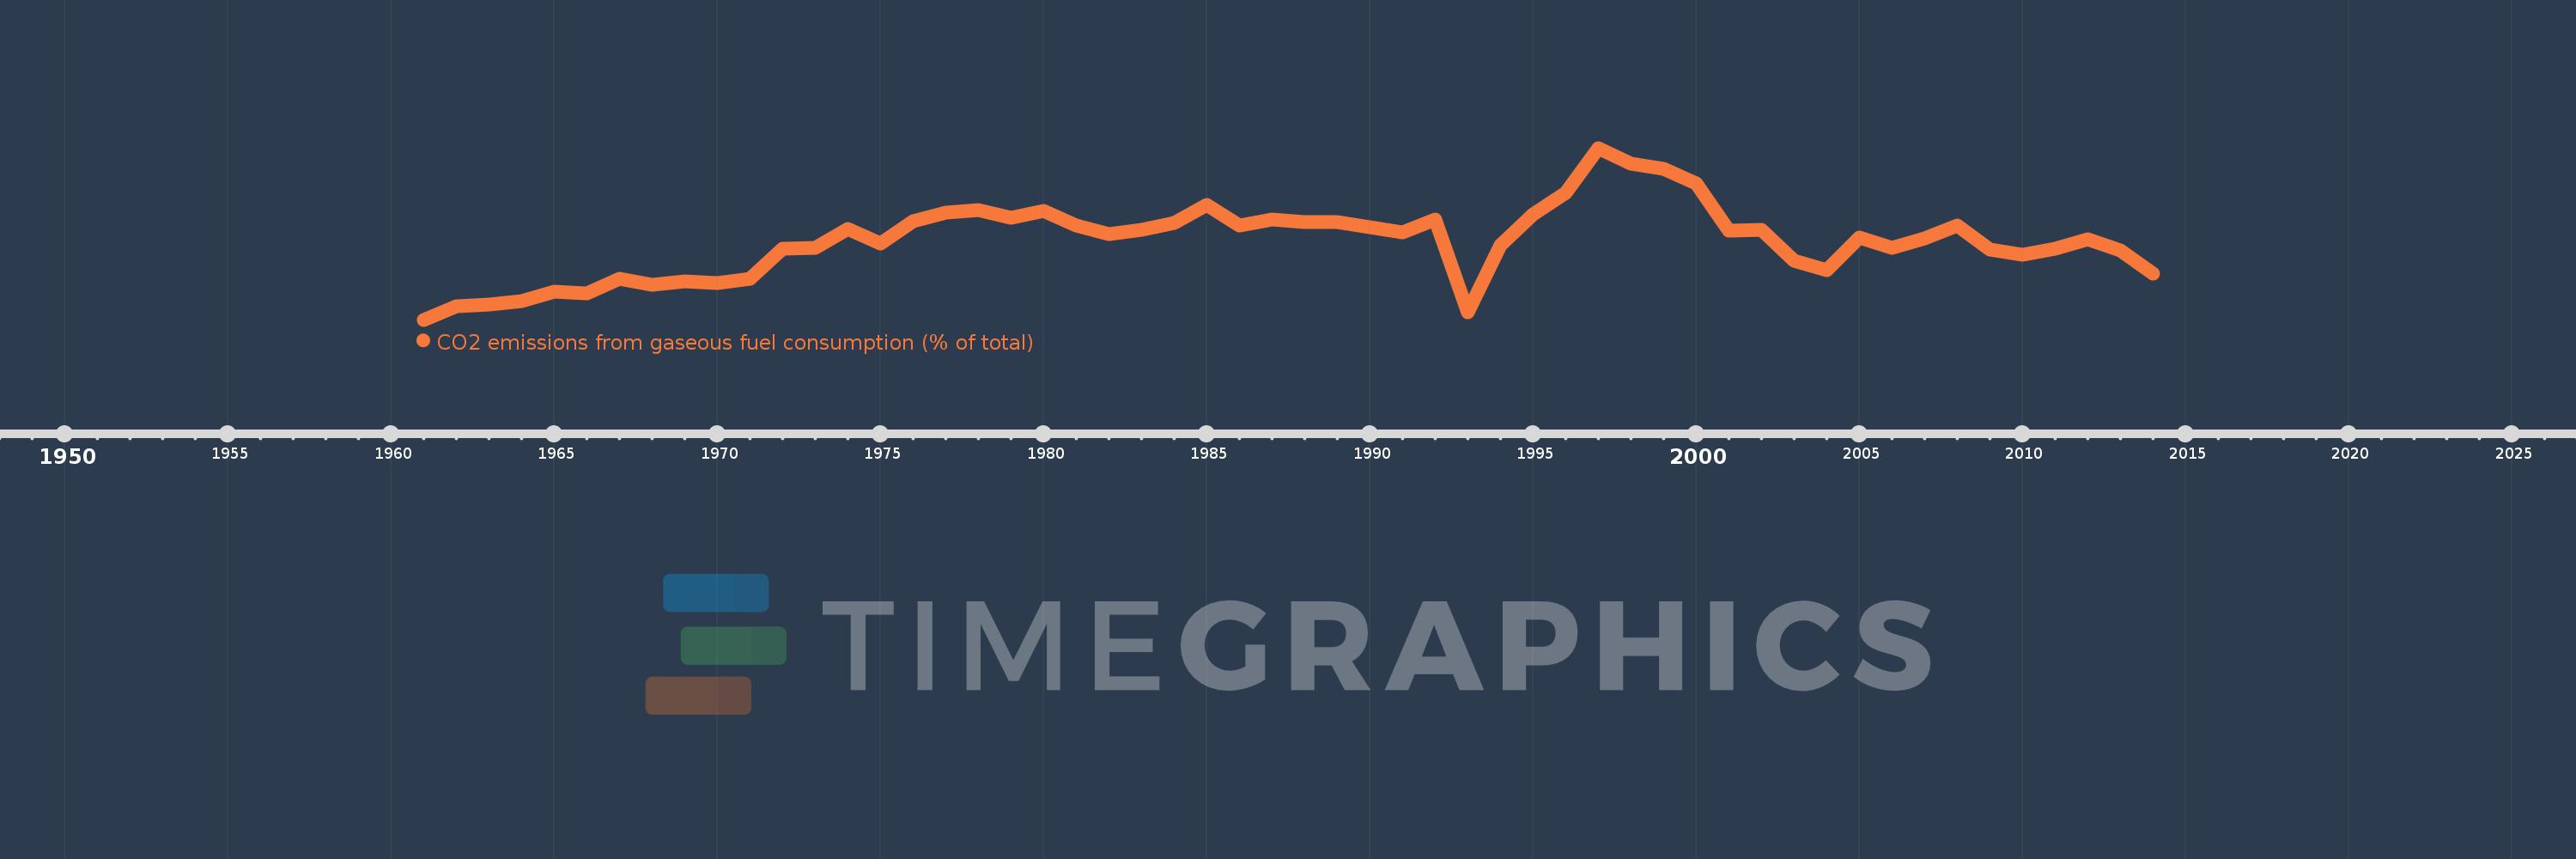
CO2 emissions from gaseous fuel consumption (% of total)
2014,2013,2012,2011,2010,2009,2008,2007,2006,2005,2004,2003,2002,2001,2000,1999,1998,1997,1996,1995,1994,1993,1992,1991,1990,1989,1988,1987,1986,1985,1984,1983,1982,1981,1980,1979,1978,1977,1976,1975,1974,1973,1972,1971,1970,1969,1968,1967,1966,1965,1964,1963,1962,1961
This statistics in other country:
AfghanistanAlbaniaAlgeriaAndorraAngolaAntigua and BarbudaArab WorldArgentinaArmeniaArubaAustraliaAustriaAzerbaijanBahamas, TheBahrainBangladeshBarbadosBelarusBelgiumBelizeBeninBermudaBhutanBoliviaBosnia and HerzegovinaBotswanaBrazilBritish Virgin IslandsBrunei DarussalamBulgariaBurkina FasoBurundiCabo VerdeCambodiaCameroonCanadaCaribbean small statesCayman IslandsCentral African RepublicCentral Europe and the BalticsChadChileChinaColombiaComorosCongo, Dem. Rep.Congo, Rep.Costa RicaCote d'IvoireCroatiaCubaCuracaoCyprusCzech RepublicDenmarkDjiboutiDominicaDominican RepublicEarly-demographic dividendEast Asia & PacificEast Asia & Pacific (excluding high income)East Asia & Pacific (IDA & IBRD countries)EcuadorEgypt, Arab Rep.El SalvadorEquatorial GuineaEritreaEstoniaEthiopiaEuro areaEurope & Central AsiaEurope & Central Asia (excluding high income)Europe & Central Asia (IDA & IBRD countries)European UnionFaroe IslandsFijiFinlandFragile and conflict affected situationsFranceFrench PolynesiaGabonGambia, TheGeorgiaGermanyGhanaGibraltarGreeceGreenlandGrenadaGuatemalaGuineaGuinea-BissauGuyanaHaitiHeavily indebted poor countries (HIPC)High incomeHondurasHong Kong SAR, ChinaHungaryIBRD onlyIcelandIDA & IBRD totalIDA blendIDA onlyIDA totalIndiaIndonesiaIran, Islamic Rep.IraqIrelandIsraelItalyJamaicaJapanJordanKazakhstanKenyaKiribatiKorea, Dem. People’s Rep.Korea, Rep.KuwaitKyrgyz RepublicLao PDRLate-demographic dividendLatin America & Caribbean Latin America & Caribbean (excluding high income)Latin America & the Caribbean (IDA & IBRD countries)LatviaLeast developed countries: UN classificationLebanonLesothoLiberiaLibyaLiechtensteinLithuaniaLow & middle incomeLow incomeLower middle incomeLuxembourgMacao SAR, ChinaMacedonia, FYRMadagascarMalawiMalaysiaMaldivesMaliMaltaMarshall IslandsMauritaniaMauritiusMexicoMicronesia, Fed. Sts.Middle East & North AfricaMiddle East & North Africa (excluding high income)Middle East & North Africa (IDA & IBRD countries)Middle incomeMoldovaMongoliaMontenegroMoroccoMozambiqueMyanmarNamibiaNauruNepalNetherlandsNew CaledoniaNew ZealandNicaraguaNigerNigeriaNorth AmericaNorwayOECD membersOmanOther small statesPacific island small statesPakistanPalauPanamaPapua New GuineaParaguayPeruPhilippinesPolandPortugalPost-demographic dividendPre-demographic dividendQatarRomaniaRussian FederationRwandaSamoaSao Tome and PrincipeSaudi ArabiaSenegalSerbiaSeychellesSierra LeoneSingaporeSint Maarten (Dutch part)Slovak RepublicSloveniaSmall statesSolomon IslandsSomaliaSouth AfricaSouth AsiaSouth Asia (IDA & IBRD)South SudanSpainSri LankaSt. Kitts and NevisSt. LuciaSt. Vincent and the GrenadinesSub-Saharan Africa Sub-Saharan Africa (excluding high income)Sub-Saharan Africa (IDA & IBRD countries)SudanSurinameSwazilandSwedenSwitzerlandSyrian Arab RepublicTajikistanTanzaniaThailandTimor-LesteTogoTongaTrinidad and TobagoTunisiaTurkeyTurkmenistanTurks and Caicos IslandsUgandaUkraineUnited Arab EmiratesUnited KingdomUnited StatesUpper middle incomeUruguayUzbekistanVanuatuVenezuela, RBVietnamWest Bank and GazaWorldYemen, Rep.ZambiaZimbabwe Timeline:
This timeline shows a graph from 1961 to 2014 of Venezuela, RB. No data until 1960. Number of actual observations by date: 54.
Source name:
World Development Indicators
Source organization:
Carbon Dioxide Information Analysis Center, Environmental Sciences Division, Oak Ridge National Laboratory, Tennessee, United States.
Categories, topics:
Energy & Mining, Climate Change, Environment
Last updated:
apr 23, 2017
Indicators value changes by year
Minimum:
16.661
jan 1, 1961
Maximum:
52.256
jan 1, 1997
At the date of observation
Value
Absolute change
Change from previous value
jan 1, 1961
16.661
+16.661
0.0%
jan 1, 1962
19.49
+2.829
16.98%
jan 1, 1963
19.776
+0.286
1.47%
jan 1, 1964
20.585
+0.808
4.09%
jan 1, 1965
22.486
+1.902
9.24%
jan 1, 1966
22.181
-0.305
-1.36%
jan 1, 1967
25.141
+2.96
13.35%
jan 1, 1968
23.863
-1.278
-5.08%
jan 1, 1969
24.7
+0.836
3.5%
jan 1, 1970
24.187
-0.513
-2.08%
jan 1, 1971
25.215
+1.028
4.25%
jan 1, 1972
31.305
+6.09
24.15%
jan 1, 1973
31.638
+0.333
1.06%
jan 1, 1974
35.545
+3.907
12.35%
jan 1, 1975
32.373
-3.171
-8.92%
jan 1, 1976
37.057
+4.683
14.47%
jan 1, 1977
38.924
+1.868
5.04%
jan 1, 1978
39.425
+0.5
1.29%
jan 1, 1979
37.818
-1.607
-4.08%
jan 1, 1980
39.261
+1.443
3.82%
jan 1, 1981
36.265
-2.995
-7.63%
jan 1, 1982
34.414
-1.851
-5.11%
jan 1, 1983
35.305
+0.892
2.59%
jan 1, 1984
36.799
+1.494
4.23%
jan 1, 1985
40.404
+3.604
9.79%
jan 1, 1986
36.145
-4.258
-10.54%
jan 1, 1987
37.477
+1.332
3.68%
jan 1, 1988
36.947
-0.53
-1.41%
jan 1, 1989
36.864
-0.083
-0.23%
jan 1, 1990
35.9
-0.963
-2.61%
jan 1, 1991
34.691
-1.209
-3.37%
jan 1, 1992
37.346
+2.655
7.65%
jan 1, 1993
18.264
-19.083
-51.1%
jan 1, 1994
32.05
+13.786
75.49%
jan 1, 1995
38.533
+6.483
20.23%
jan 1, 1996
42.904
+4.371
11.34%
jan 1, 1997
52.256
+9.352
21.8%
jan 1, 1998
49.049
-3.207
-6.14%
jan 1, 1999
48.012
-1.037
-2.11%
jan 1, 2000
44.975
-3.038
-6.33%
jan 1, 2001
35.041
-9.934
-22.09%
jan 1, 2002
35.298
+0.257
0.73%
jan 1, 2003
28.842
-6.456
-18.29%
jan 1, 2004
26.999
-1.843
-6.39%
jan 1, 2005
33.706
+6.707
24.84%
jan 1, 2006
31.545
-2.162
-6.41%
jan 1, 2007
33.513
+1.968
6.24%
jan 1, 2008
36.107
+2.594
7.74%
jan 1, 2009
31.229
-4.878
-13.51%
jan 1, 2010
30.213
-1.017
-3.26%
jan 1, 2011
31.329
+1.116
3.69%
jan 1, 2012
33.262
+1.934
6.17%
jan 1, 2013
31.108
-2.155
-6.48%
jan 1, 2014
26.169
-4.939
-15.88%
Ranking of countries by current statistics by years


Comments: