29
/
en
AIzaSyAYiBZKx7MnpbEhh9jyipgxe19OcubqV5w
April 1, 2024
74717
Azerbaijan
AZE
true
2
1
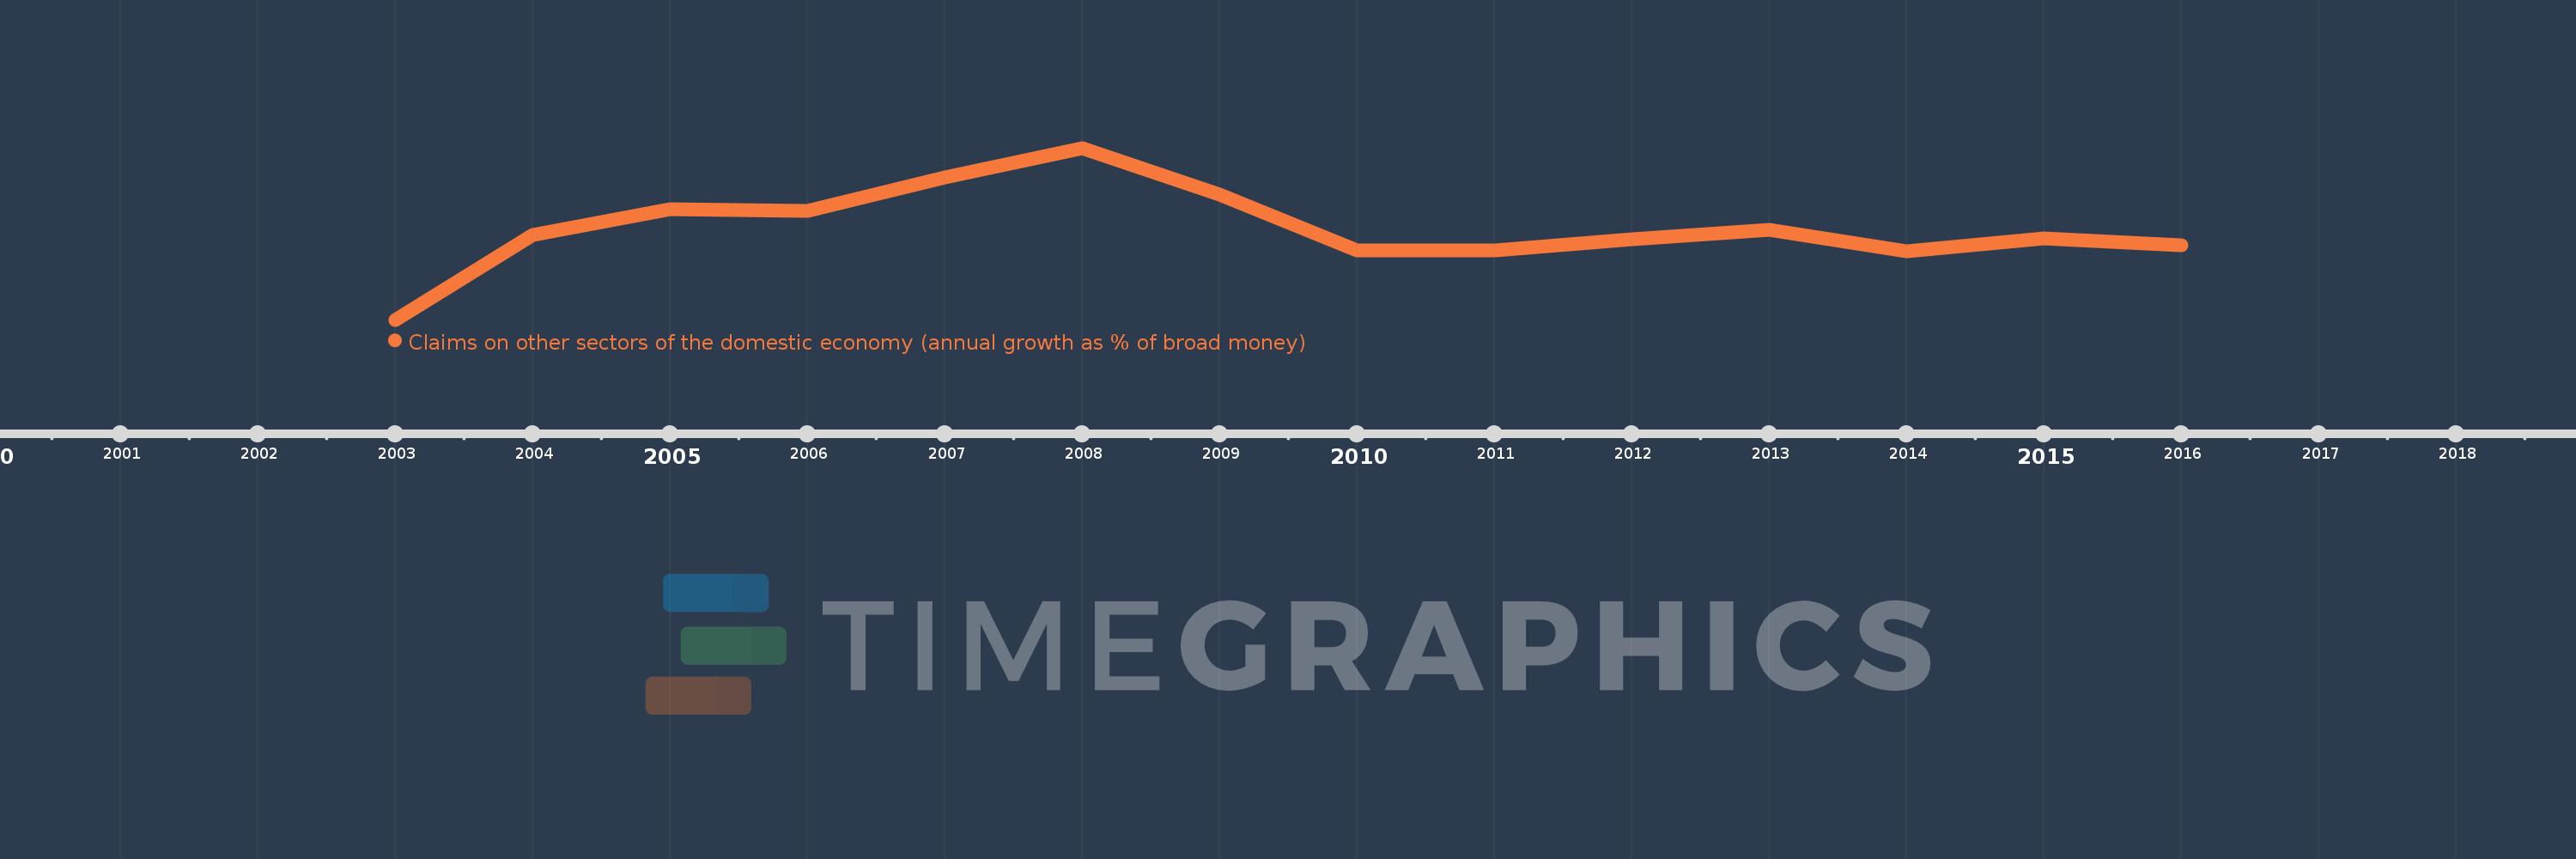
Claims on other sectors of the domestic economy (annual growth as % of broad money)
2016,2015,2014,2013,2012,2011,2010,2009,2008,2007,2006,2005,2004,2003
This statistics in other country:
Timeline:
This timeline shows a graph from 2003 to 2016 of Azerbaijan. No data until 2002. Number of actual observations by date: 14.
Source name:
World Development Indicators
Source organization:
International Monetary Fund, International Financial Statistics and data files.
Categories, topics:
Financial Sector
Last updated:
apr 23, 2017
Indicators value changes by year
Minimum:
-23.92
jan 1, 2003
Maximum:
67.549
jan 1, 2008
At the date of observation
Value
Absolute change
Change from previous value
jan 1, 2003
-23.92
-23.92
0.0%
jan 1, 2004
21.226
+45.146
-188.74%
jan 1, 2005
35.124
+13.898
65.47%
jan 1, 2006
33.854
-1.269
-3.61%
jan 1, 2007
51.922
+18.067
53.37%
jan 1, 2008
67.549
+15.628
30.1%
jan 1, 2009
42.881
-24.669
-36.52%
jan 1, 2010
13.2
-29.681
-69.22%
jan 1, 2011
12.879
-0.321
-2.43%
jan 1, 2012
18.893
+6.013
46.69%
jan 1, 2013
24.048
+5.155
27.29%
jan 1, 2014
12.648
-11.4
-47.41%
jan 1, 2015
19.192
+6.544
51.74%
jan 1, 2016
15.892
-3.299
-17.19%
Ranking of countries by current statistics by years


Comments: