29
/
en
AIzaSyAYiBZKx7MnpbEhh9jyipgxe19OcubqV5w
April 1, 2024
228220
Romania
ROU
true
2
1
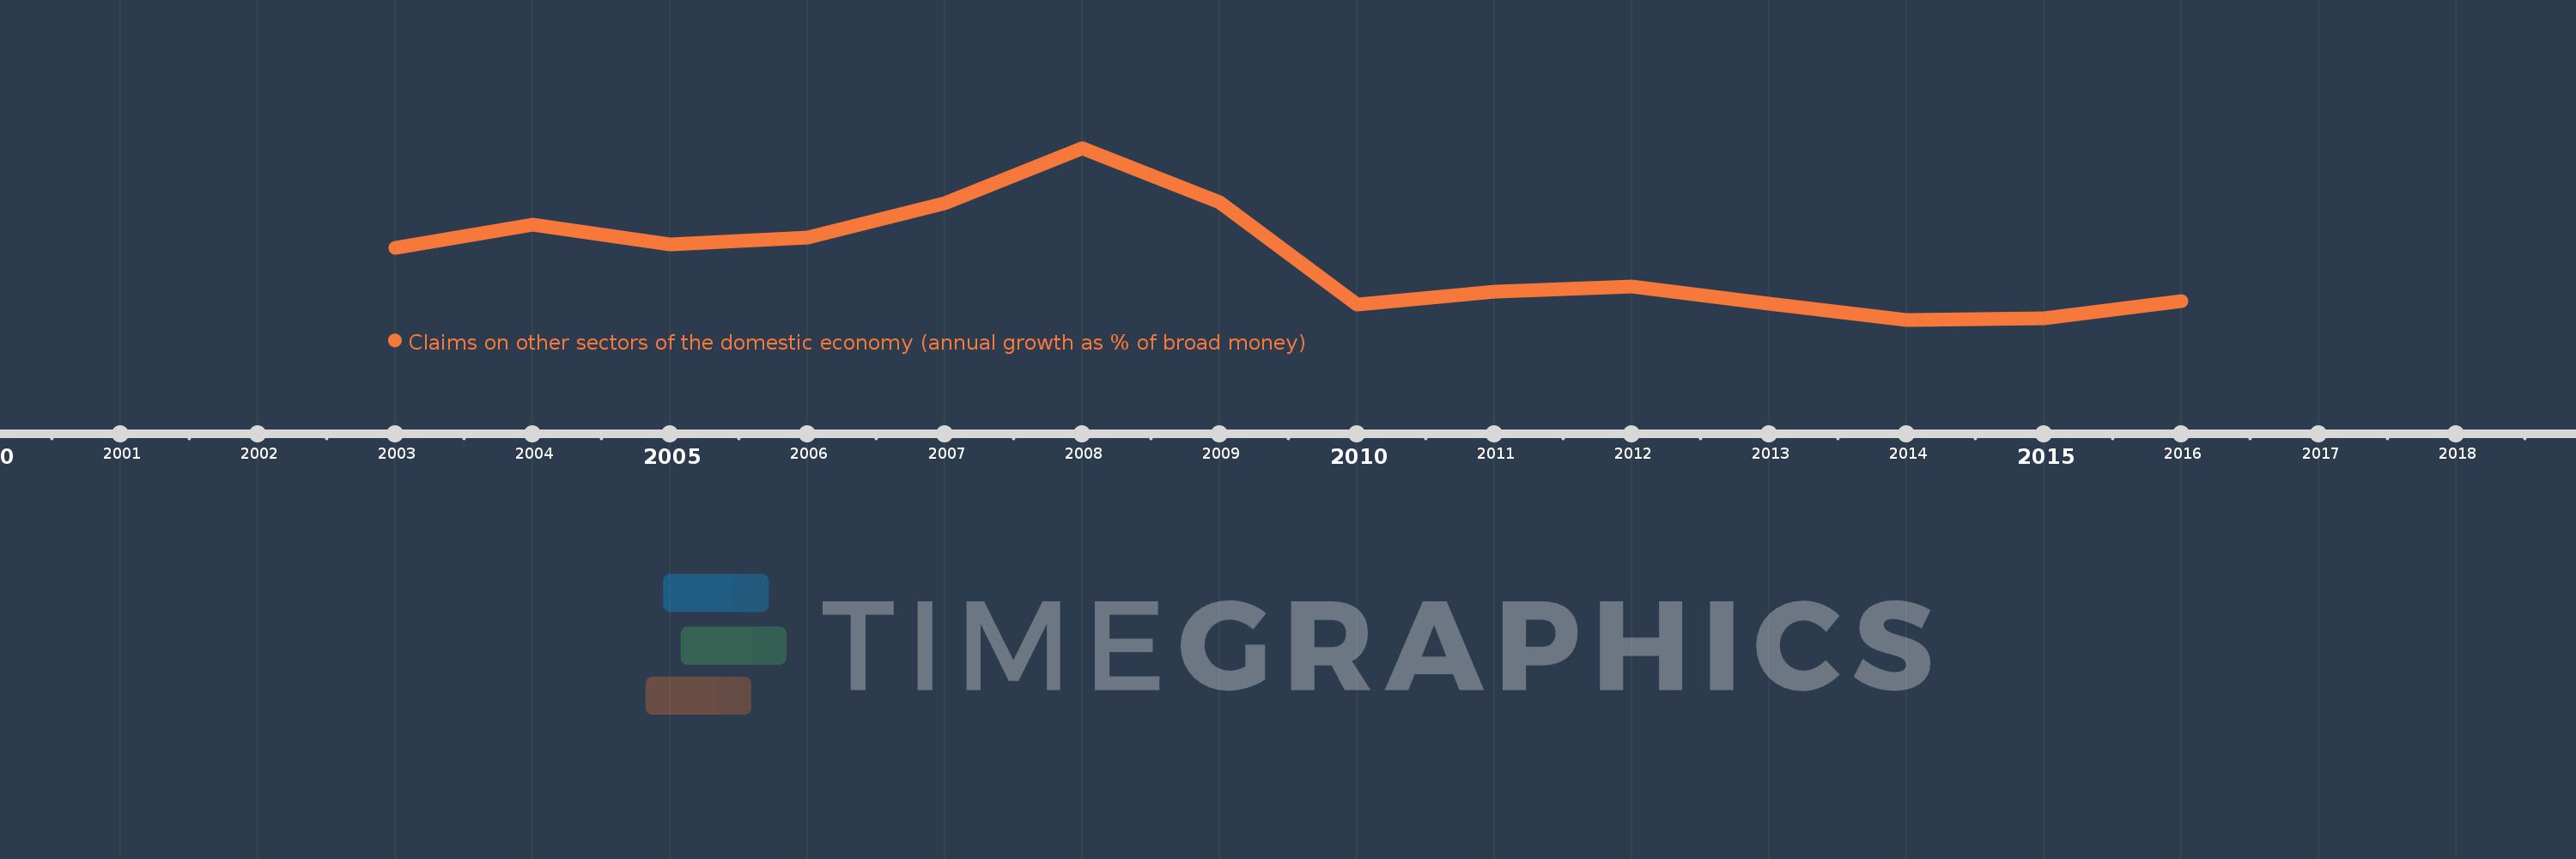
Claims on other sectors of the domestic economy (annual growth as % of broad money)
2016,2015,2014,2013,2012,2011,2010,2009,2008,2007,2006,2005,2004,2003
This statistics in other country:
Timeline:
This timeline shows a graph from 2003 to 2016 of Romania. No data until 2002. Number of actual observations by date: 14.
Source name:
World Development Indicators
Source organization:
International Monetary Fund, International Financial Statistics and data files.
Categories, topics:
Financial Sector
Last updated:
apr 23, 2017
Indicators value changes by year
Minimum:
-3.186
jan 1, 2014
Maximum:
52.275
jan 1, 2008
At the date of observation
Value
Absolute change
Change from previous value
jan 1, 2003
20.007
+20.007
0.0%
jan 1, 2004
27.408
+7.401
36.99%
jan 1, 2005
21.075
-6.333
-23.11%
jan 1, 2006
23.401
+2.326
11.04%
jan 1, 2007
34.511
+11.11
47.48%
jan 1, 2008
52.275
+17.764
51.47%
jan 1, 2009
34.662
-17.613
-33.69%
jan 1, 2010
1.859
-32.803
-94.64%
jan 1, 2011
5.779
+3.92
210.88%
jan 1, 2012
7.41
+1.631
28.22%
jan 1, 2013
2.138
-5.272
-71.15%
jan 1, 2014
-3.186
-5.324
-249.06%
jan 1, 2015
-2.665
+0.522
-16.37%
jan 1, 2016
2.725
+5.39
-202.28%
Ranking of countries by current statistics by years


Comments: