29
/
en
AIzaSyAYiBZKx7MnpbEhh9jyipgxe19OcubqV5w
April 1, 2024
250545
St. Lucia
LCA
true
2
1
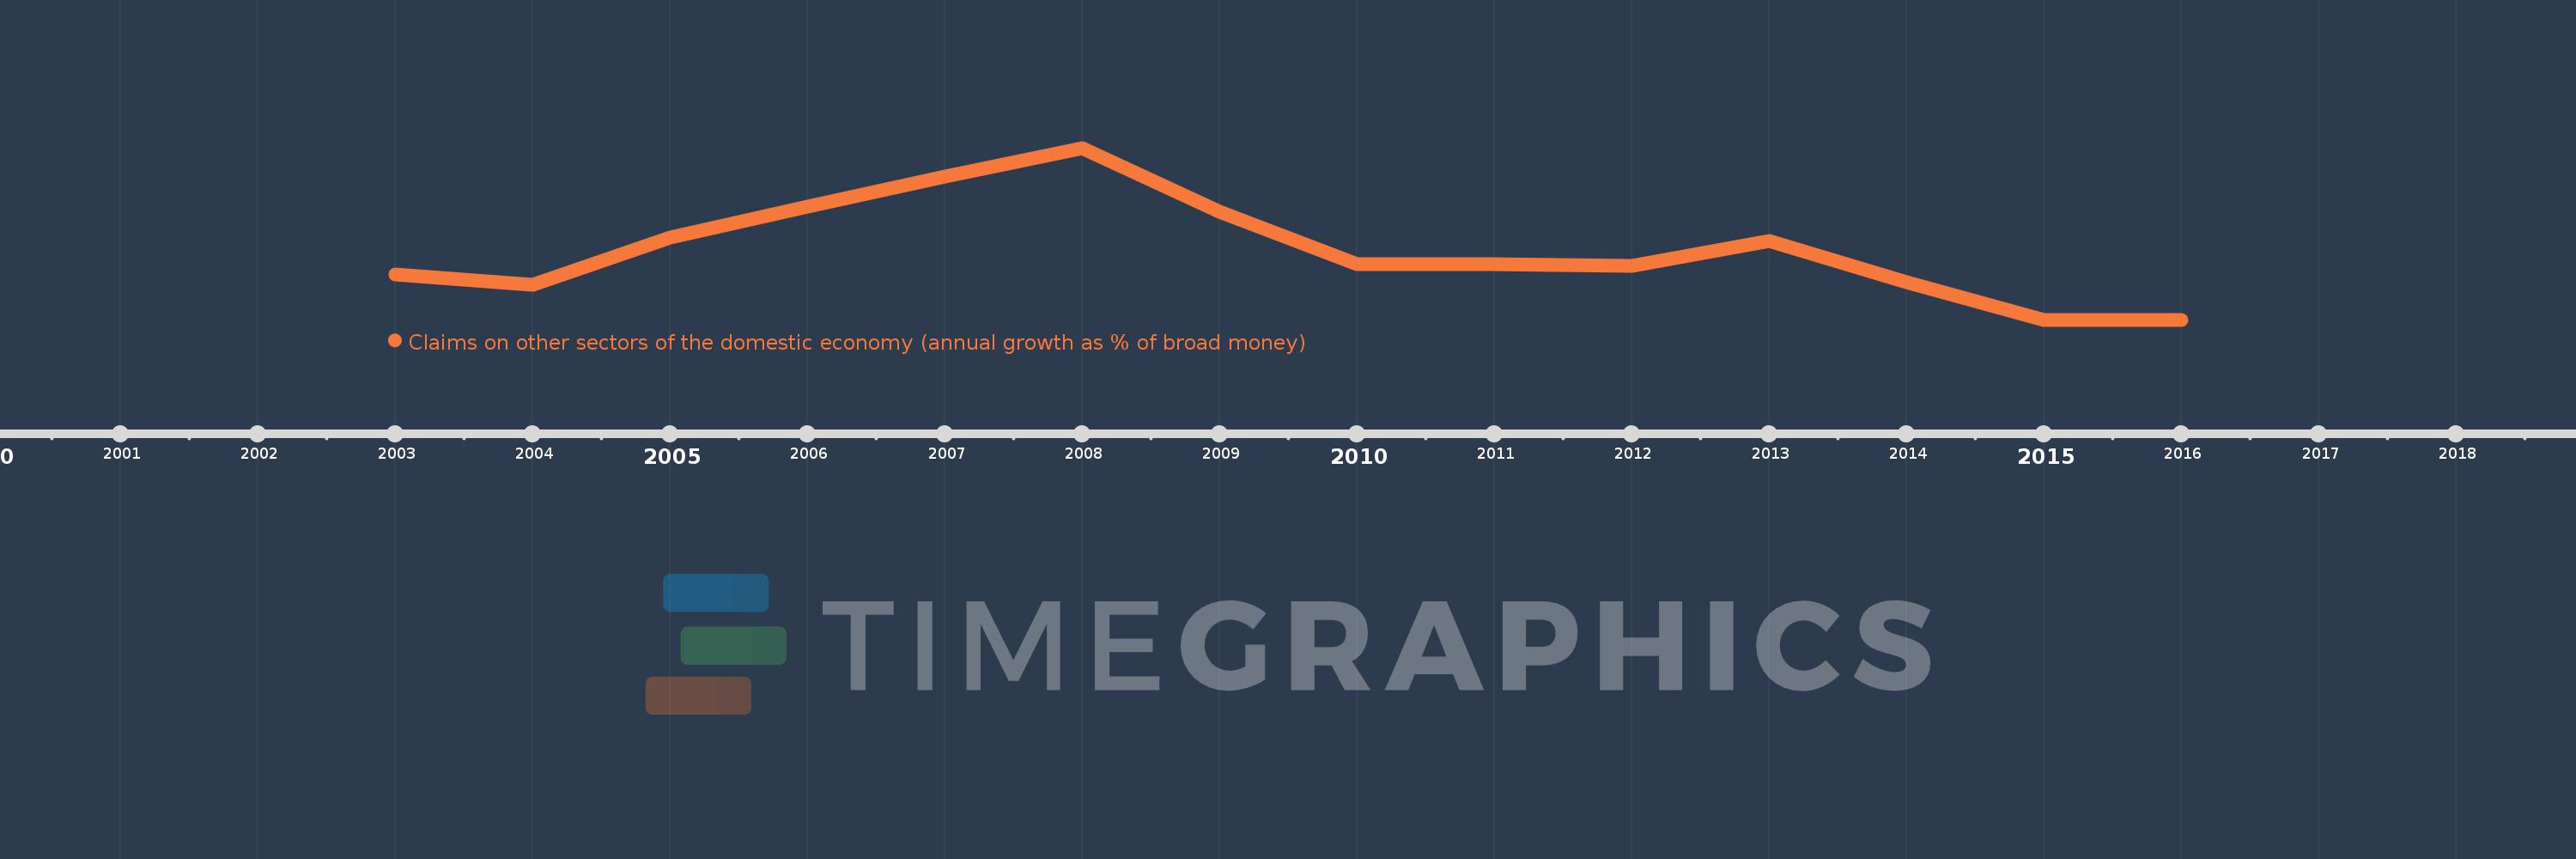
Claims on other sectors of the domestic economy (annual growth as % of broad money)
2016,2015,2014,2013,2012,2011,2010,2009,2008,2007,2006,2005,2004,2003
This statistics in other country:
Timeline:
This timeline shows a graph from 2003 to 2016 of St. Lucia. No data until 2002. Number of actual observations by date: 14.
Source name:
World Development Indicators
Source organization:
International Monetary Fund, International Financial Statistics and data files.
Categories, topics:
Financial Sector
Last updated:
apr 23, 2017
Indicators value changes by year
Minimum:
-8.815
jan 1, 2016
Maximum:
28.191
jan 1, 2008
At the date of observation
Value
Absolute change
Change from previous value
jan 1, 2003
0.923
+0.923
0.0%
jan 1, 2004
-1.29
-2.213
-239.81%
jan 1, 2005
8.821
+10.111
-783.86%
jan 1, 2006
15.549
+6.728
76.27%
jan 1, 2007
22.003
+6.454
41.51%
jan 1, 2008
28.191
+6.188
28.12%
jan 1, 2009
14.368
-13.824
-49.04%
jan 1, 2010
3.194
-11.173
-77.77%
jan 1, 2011
3.168
-0.026
-0.8%
jan 1, 2012
2.855
-0.313
-9.89%
jan 1, 2013
8.209
+5.354
187.5%
jan 1, 2014
-0.687
-8.896
-108.37%
jan 1, 2015
-8.798
-8.11
1.18K%
jan 1, 2016
-8.815
-0.018
0.2%
Ranking of countries by current statistics by years


Comments: