29
/
en
AIzaSyAYiBZKx7MnpbEhh9jyipgxe19OcubqV5w
April 1, 2024
260620
Tanzania
TZA
true
2
1
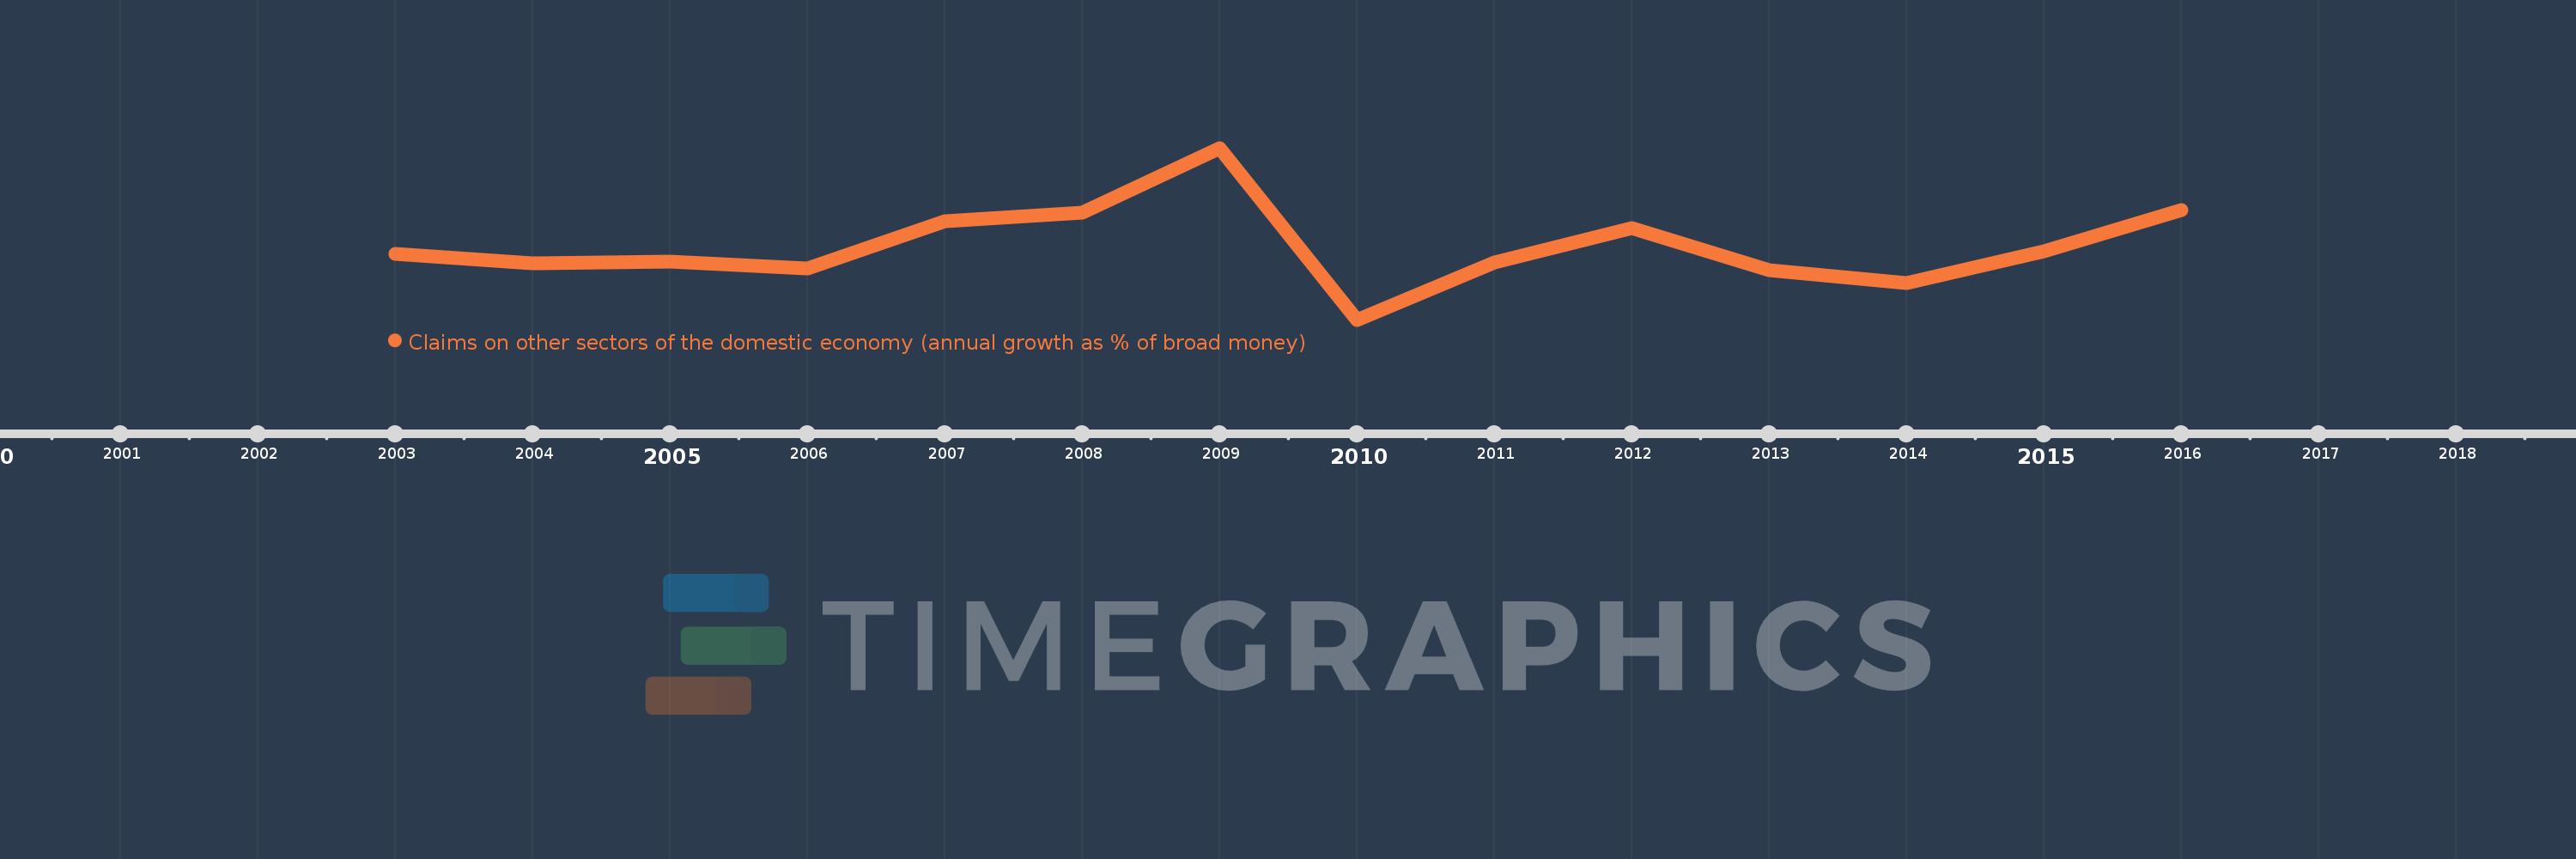
Claims on other sectors of the domestic economy (annual growth as % of broad money)
2016,2015,2014,2013,2012,2011,2010,2009,2008,2007,2006,2005,2004,2003
This statistics in other country:
Timeline:
This timeline shows a graph from 2003 to 2016 of Tanzania. No data until 2002. Number of actual observations by date: 14.
Source name:
World Development Indicators
Source organization:
International Monetary Fund, International Financial Statistics and data files.
Categories, topics:
Financial Sector
Last updated:
apr 23, 2017
Indicators value changes by year
Maximum:
22.575
jan 1, 2009
At the date of observation
Value
Absolute change
Change from previous value
jan 1, 2003
12.247
+12.247
0.0%
jan 1, 2004
11.378
-0.87
-7.1%
jan 1, 2005
11.523
+0.145
1.27%
jan 1, 2006
10.83
-0.693
-6.01%
jan 1, 2007
15.429
+4.6
42.47%
jan 1, 2008
16.286
+0.856
5.55%
jan 1, 2009
22.575
+6.289
38.62%
jan 1, 2010
5.842
-16.733
-74.12%
jan 1, 2011
11.388
+5.546
94.94%
jan 1, 2012
14.806
+3.418
30.02%
jan 1, 2013
10.66
-4.146
-28.0%
jan 1, 2014
9.427
-1.233
-11.57%
jan 1, 2015
12.539
+3.112
33.02%
jan 1, 2016
16.549
+4.01
31.98%
Ranking of countries by current statistics by years


Comments: