29
/
en
AIzaSyAYiBZKx7MnpbEhh9jyipgxe19OcubqV5w
April 1, 2024
202650
Mozambique
MOZ
true
2
1
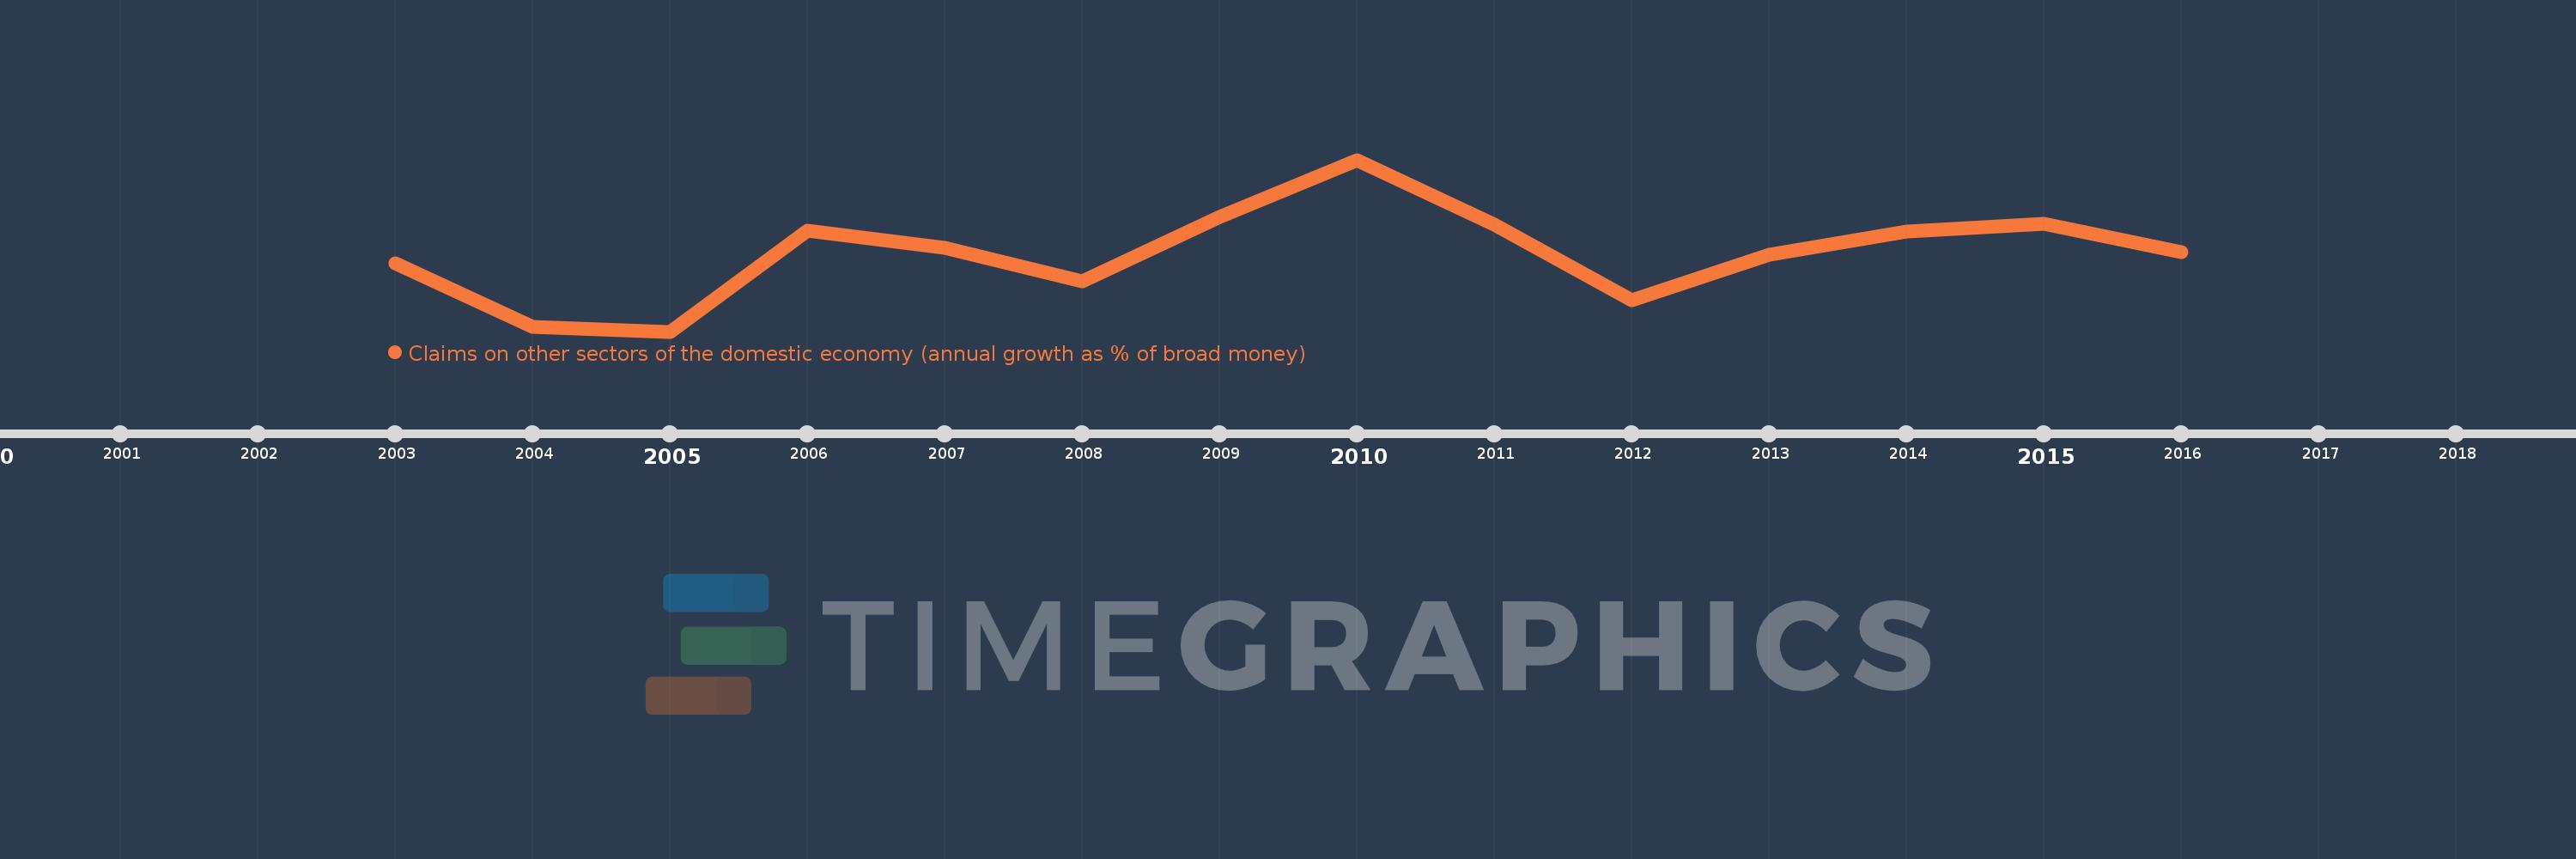
Claims on other sectors of the domestic economy (annual growth as % of broad money)
2016,2015,2014,2013,2012,2011,2010,2009,2008,2007,2006,2005,2004,2003
This statistics in other country:
Timeline:
This timeline shows a graph from 2003 to 2016 of Mozambique. No data until 2002. Number of actual observations by date: 14.
Source name:
World Development Indicators
Source organization:
International Monetary Fund, International Financial Statistics and data files.
Categories, topics:
Financial Sector
Last updated:
apr 23, 2017
Indicators value changes by year
Minimum:
-1.929
jan 1, 2005
Maximum:
32.702
jan 1, 2010
At the date of observation
Value
Absolute change
Change from previous value
jan 1, 2003
11.899
+11.899
0.0%
jan 1, 2004
-0.904
-12.803
-107.6%
jan 1, 2005
-1.929
-1.025
113.42%
jan 1, 2006
18.499
+20.428
-1.06K%
jan 1, 2007
14.874
-3.625
-19.59%
jan 1, 2008
8.126
-6.749
-45.37%
jan 1, 2009
21.111
+12.985
159.81%
jan 1, 2010
32.702
+11.591
54.9%
jan 1, 2011
19.548
-13.154
-40.22%
jan 1, 2012
4.407
-15.141
-77.46%
jan 1, 2013
13.615
+9.208
208.94%
jan 1, 2014
18.189
+4.574
33.59%
jan 1, 2015
19.871
+1.683
9.25%
jan 1, 2016
14.163
-5.708
-28.72%
Ranking of countries by current statistics by years


Comments: