29
/
en
AIzaSyAYiBZKx7MnpbEhh9jyipgxe19OcubqV5w
April 1, 2024
131774
Fiji
FJI
true
2
1
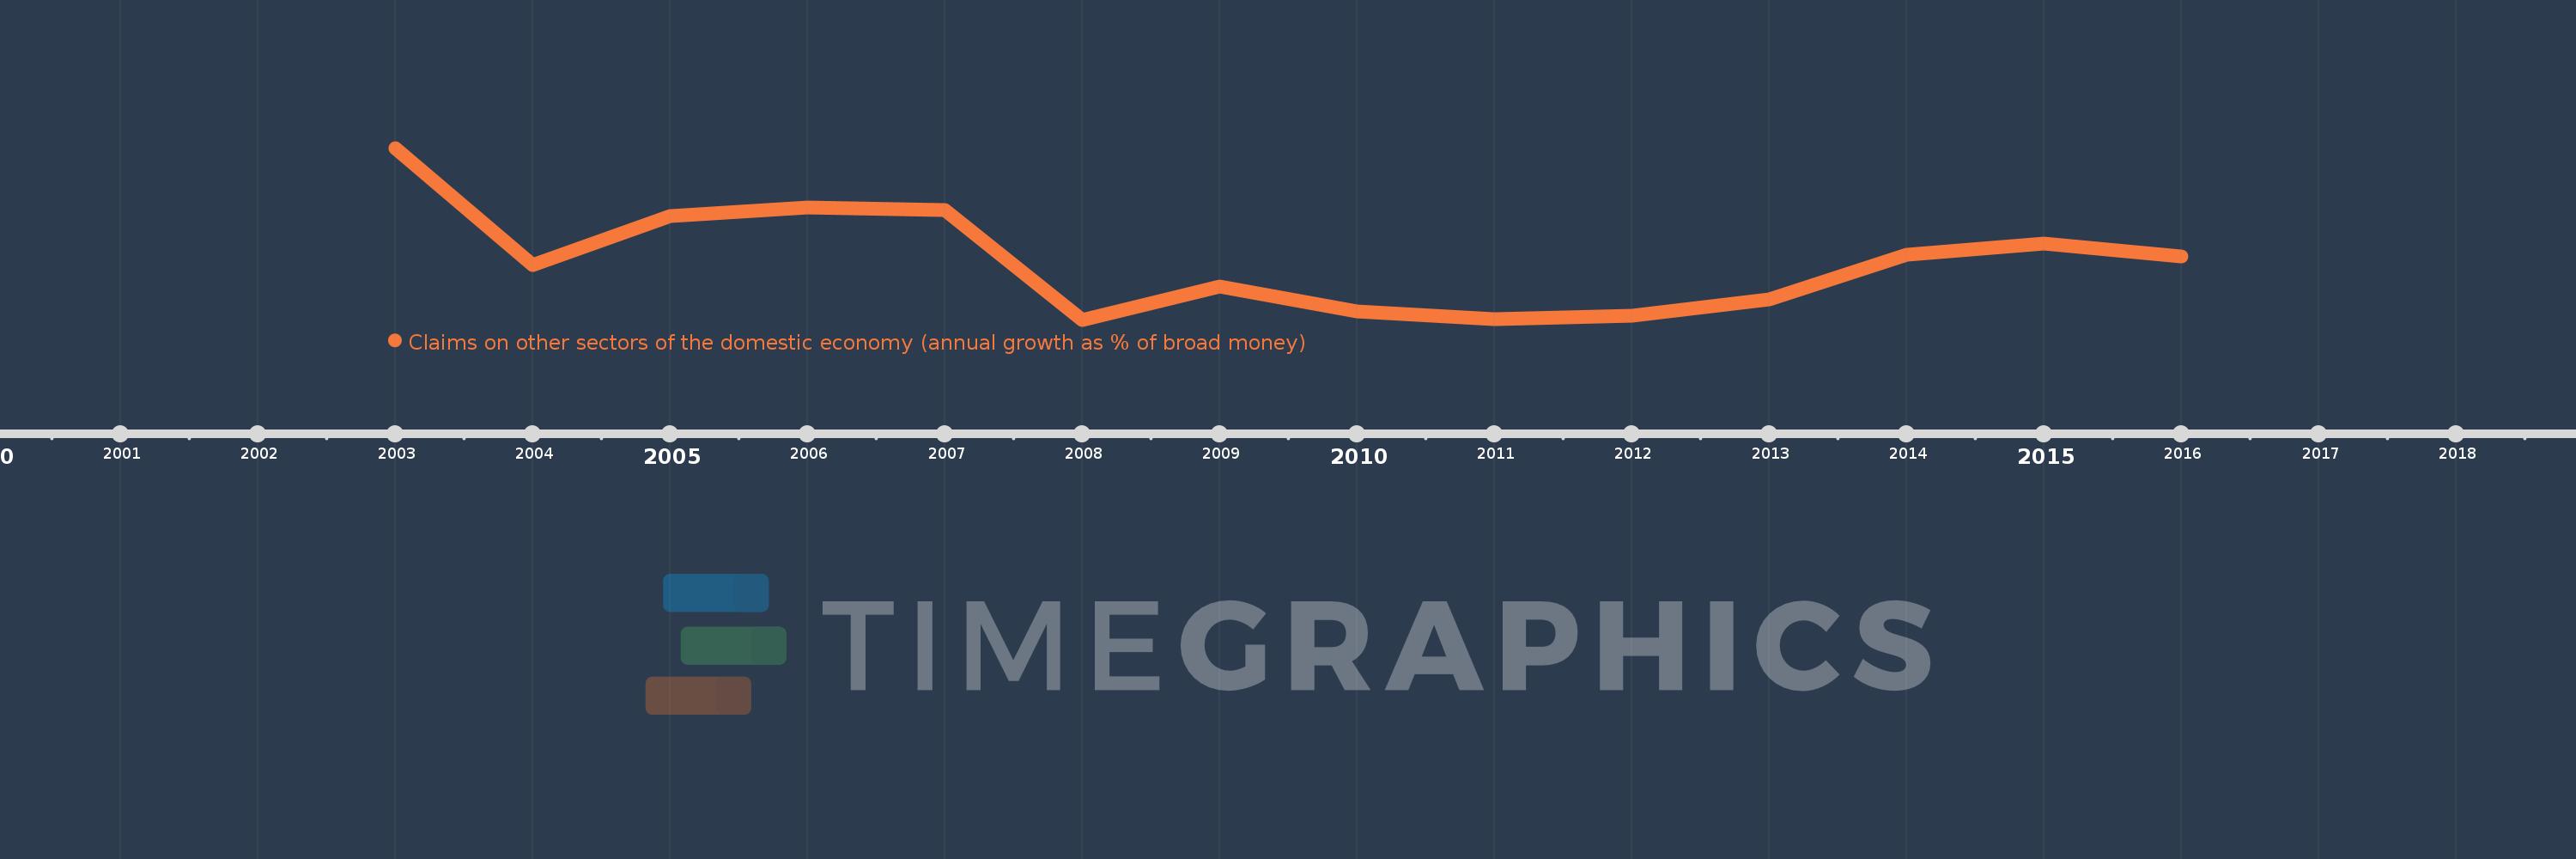
Claims on other sectors of the domestic economy (annual growth as % of broad money)
2016,2015,2014,2013,2012,2011,2010,2009,2008,2007,2006,2005,2004,2003
This statistics in other country:
Timeline:
This timeline shows a graph from 2003 to 2016 of Fiji. No data until 2002. Number of actual observations by date: 14.
Source name:
World Development Indicators
Source organization:
International Monetary Fund, International Financial Statistics and data files.
Categories, topics:
Financial Sector
Last updated:
apr 23, 2017
Indicators value changes by year
Maximum:
30.603
jan 1, 2003
At the date of observation
Value
Absolute change
Change from previous value
jan 1, 2003
30.603
+30.603
0.0%
jan 1, 2004
10.738
-19.866
-64.91%
jan 1, 2005
19.065
+8.328
77.55%
jan 1, 2006
20.604
+1.538
8.07%
jan 1, 2007
20.044
-0.559
-2.71%
jan 1, 2008
1.545
-18.5
-92.29%
jan 1, 2009
7.15
+5.605
362.89%
jan 1, 2010
2.947
-4.203
-58.78%
jan 1, 2011
1.68
-1.267
-43.0%
jan 1, 2012
2.222
+0.542
32.28%
jan 1, 2013
4.919
+2.697
121.36%
jan 1, 2014
12.556
+7.637
155.25%
jan 1, 2015
14.483
+1.928
15.35%
jan 1, 2016
12.224
-2.259
-15.6%
Ranking of countries by current statistics by years


Comments: