29
/
en
AIzaSyAYiBZKx7MnpbEhh9jyipgxe19OcubqV5w
April 1, 2024
152311
Hungary
HUN
true
2
1
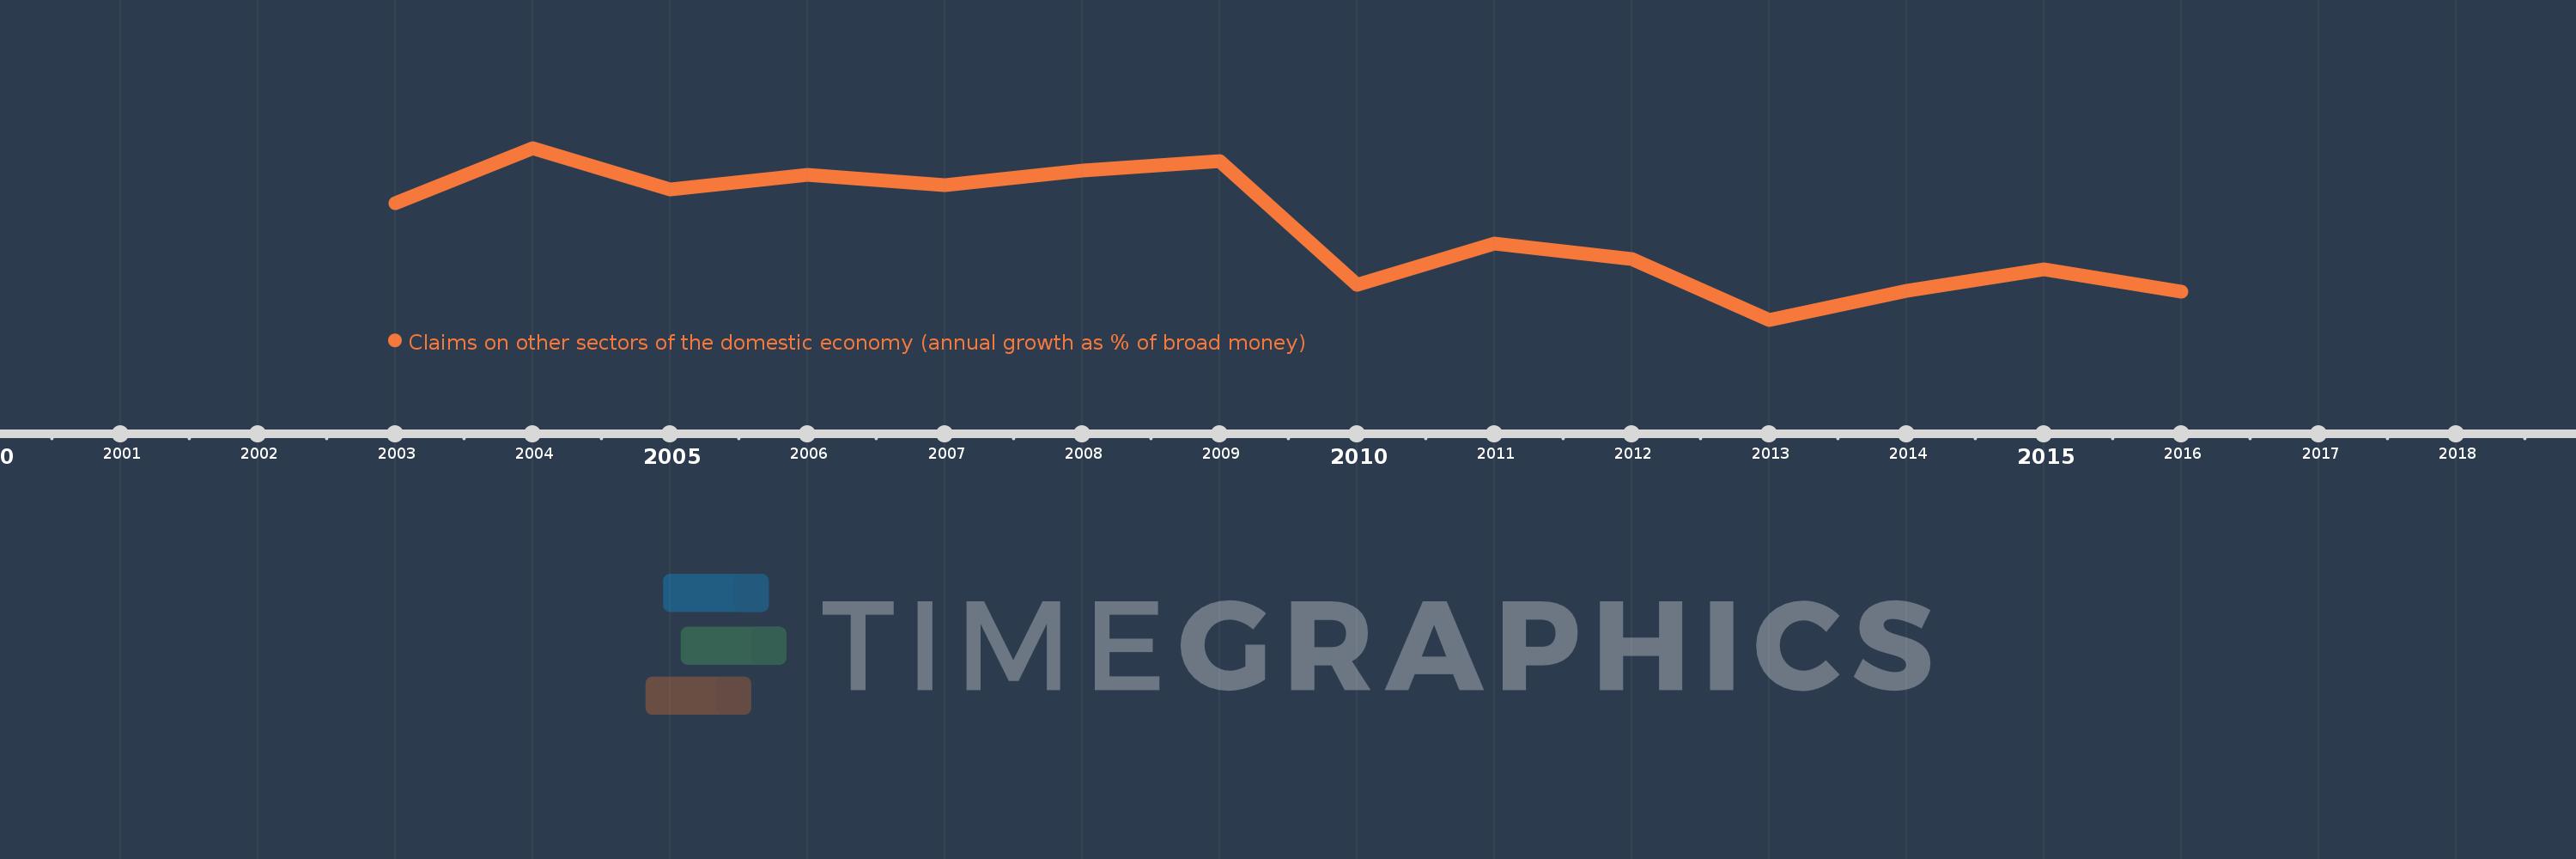
Claims on other sectors of the domestic economy (annual growth as % of broad money)
2016,2015,2014,2013,2012,2011,2010,2009,2008,2007,2006,2005,2004,2003
This statistics in other country:
Timeline:
This timeline shows a graph from 2003 to 2016 of Hungary. No data until 2002. Number of actual observations by date: 14.
Source name:
World Development Indicators
Source organization:
International Monetary Fund, International Financial Statistics and data files.
Categories, topics:
Financial Sector
Last updated:
apr 23, 2017
Indicators value changes by year
Minimum:
-14.38
jan 1, 2013
Maximum:
27.134
jan 1, 2004
At the date of observation
Value
Absolute change
Change from previous value
jan 1, 2003
13.858
+13.858
0.0%
jan 1, 2004
27.134
+13.276
95.8%
jan 1, 2005
17.058
-10.076
-37.13%
jan 1, 2006
20.614
+3.556
20.84%
jan 1, 2007
18.217
-2.396
-11.62%
jan 1, 2008
21.688
+3.47
19.05%
jan 1, 2009
23.999
+2.311
10.65%
jan 1, 2010
-6.015
-30.013
-125.06%
jan 1, 2011
4.002
+10.017
-166.54%
jan 1, 2012
0.384
-3.618
-90.41%
jan 1, 2013
-14.38
-14.764
-3.85K%
jan 1, 2014
-7.284
+7.096
-49.35%
jan 1, 2015
-2.095
+5.189
-71.24%
jan 1, 2016
-7.663
-5.568
265.83%
Ranking of countries by current statistics by years


Comments: