29
/
en
AIzaSyAYiBZKx7MnpbEhh9jyipgxe19OcubqV5w
April 1, 2024
104650
Chile
CHL
true
2
1
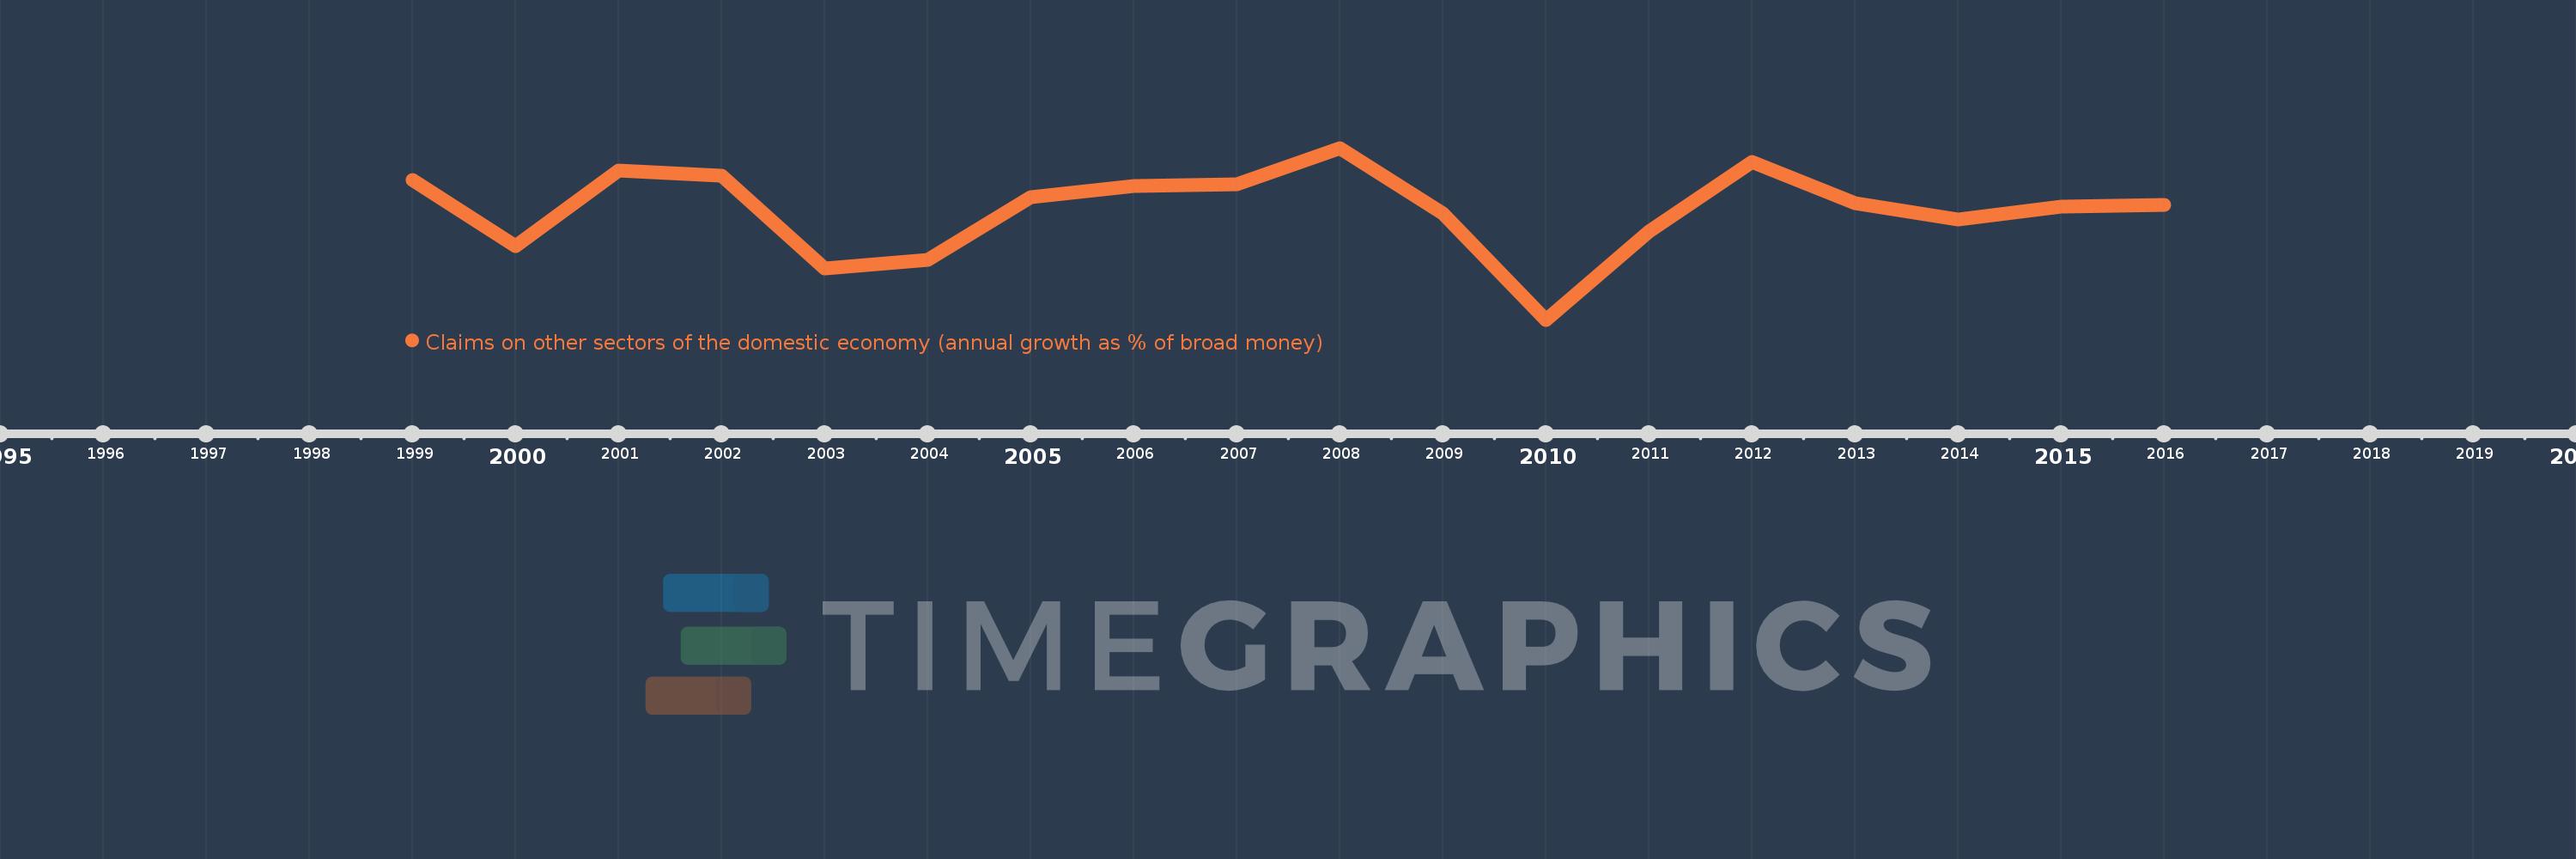
Claims on other sectors of the domestic economy (annual growth as % of broad money)
2016,2015,2014,2013,2012,2011,2010,2009,2008,2007,2006,2005,2004,2003,2002,2001,2000,1999
This statistics in other country:
Timeline:
This timeline shows a graph from 1999 to 2016 of Chile. No data until 1998. Number of actual observations by date: 18.
Source name:
World Development Indicators
Source organization:
International Monetary Fund, International Financial Statistics and data files.
Categories, topics:
Financial Sector
Last updated:
apr 23, 2017
Indicators value changes by year
Minimum:
-1.963
jan 1, 2010
Maximum:
18.312
jan 1, 2008
At the date of observation
Value
Absolute change
Change from previous value
jan 1, 1999
14.524
+14.524
0.0%
jan 1, 2000
6.693
-7.831
-53.92%
jan 1, 2001
15.655
+8.962
133.91%
jan 1, 2002
15.056
-0.599
-3.83%
jan 1, 2003
4.088
-10.968
-72.85%
jan 1, 2004
5.08
+0.992
24.25%
jan 1, 2005
12.513
+7.433
146.33%
jan 1, 2006
13.806
+1.293
10.34%
jan 1, 2007
14.057
+0.251
1.82%
jan 1, 2008
18.312
+4.255
30.27%
jan 1, 2009
10.572
-7.74
-42.27%
jan 1, 2010
-1.963
-12.535
-118.57%
jan 1, 2011
8.481
+10.444
-532.06%
jan 1, 2012
16.666
+8.185
96.51%
jan 1, 2013
11.807
-4.859
-29.16%
jan 1, 2014
9.88
-1.927
-16.32%
jan 1, 2015
11.379
+1.498
15.17%
jan 1, 2016
11.606
+0.227
1.99%
Ranking of countries by current statistics by years


Comments: