29
/
en
AIzaSyAYiBZKx7MnpbEhh9jyipgxe19OcubqV5w
April 1, 2024
243408
Solomon Islands
SLB
true
2
1
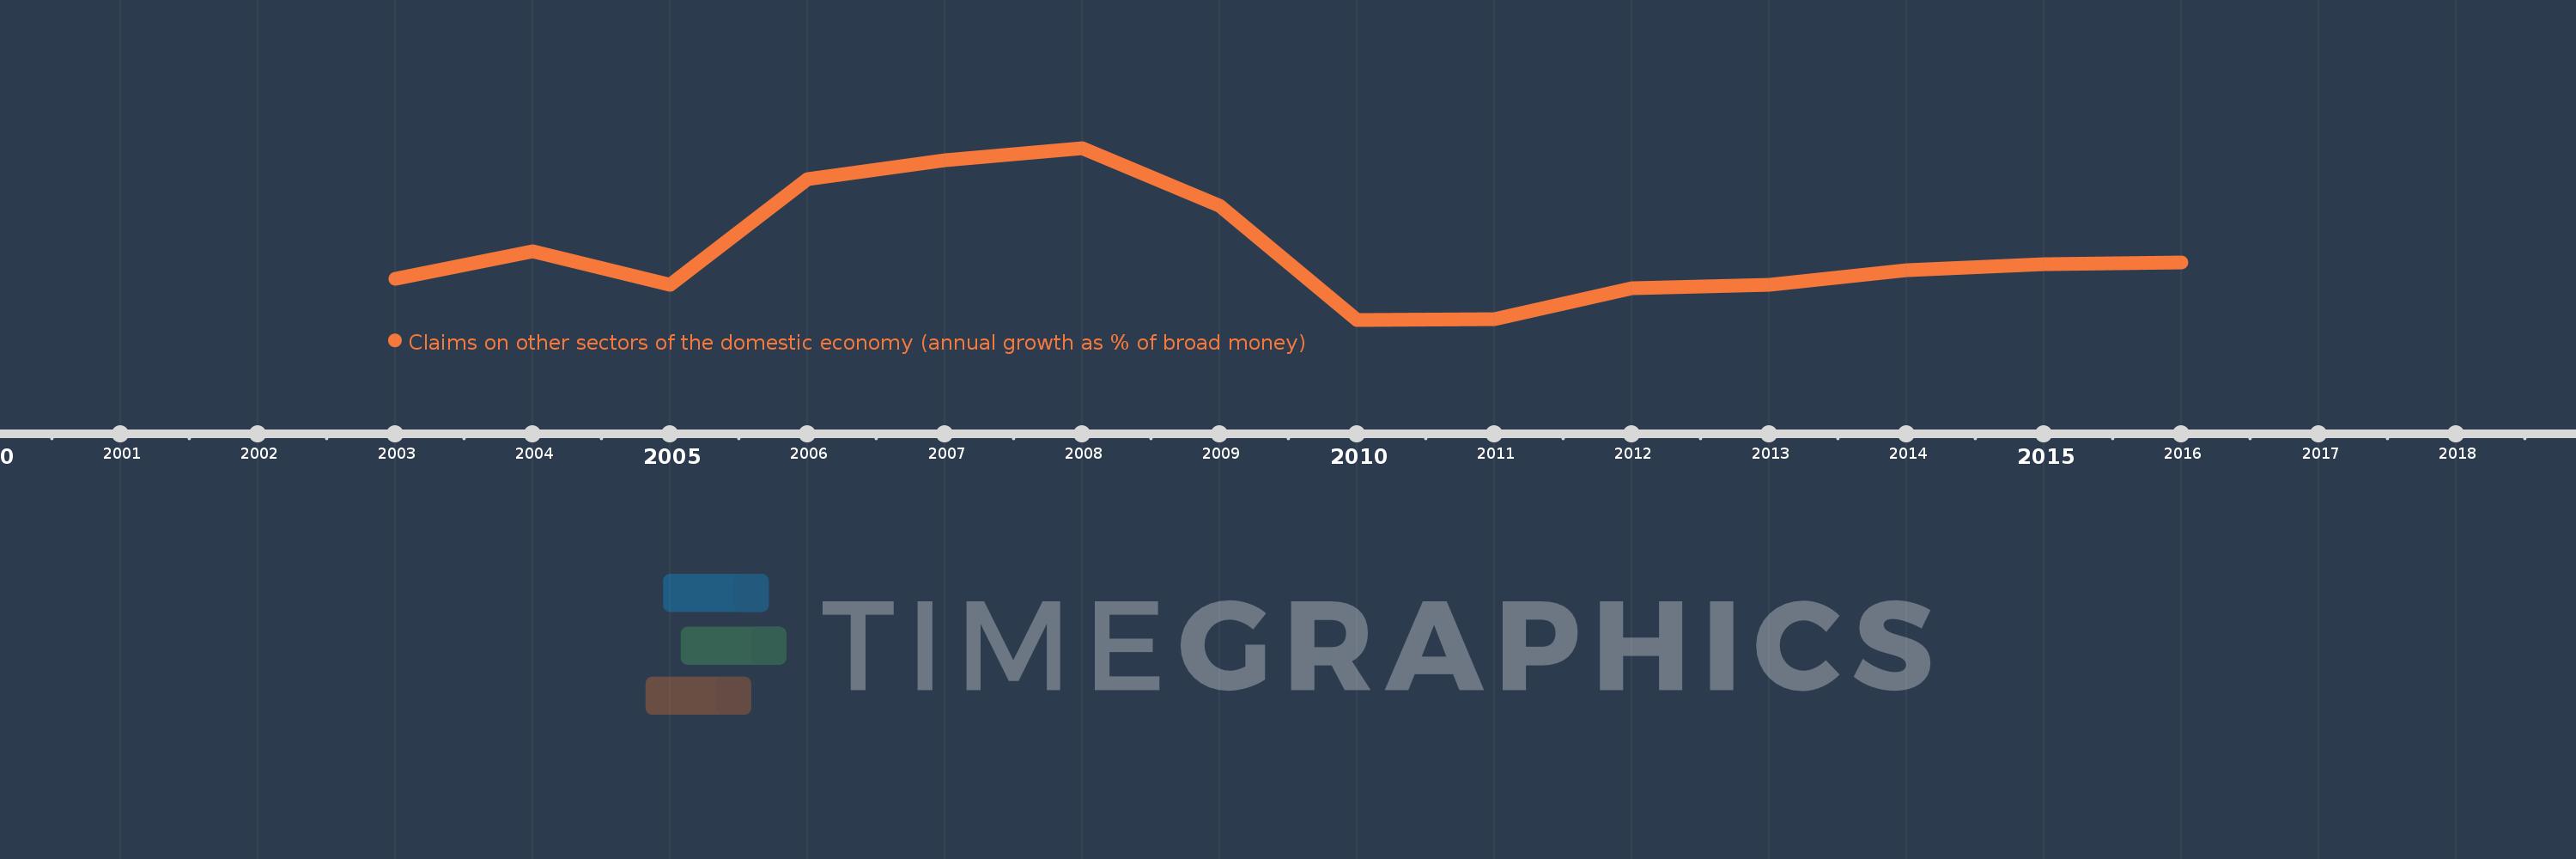
Claims on other sectors of the domestic economy (annual growth as % of broad money)
2016,2015,2014,2013,2012,2011,2010,2009,2008,2007,2006,2005,2004,2003
This statistics in other country:
Timeline:
This timeline shows a graph from 2003 to 2016 of Solomon Islands. No data until 2002. Number of actual observations by date: 14.
Source name:
World Development Indicators
Source organization:
International Monetary Fund, International Financial Statistics and data files.
Categories, topics:
Financial Sector
Last updated:
apr 23, 2017
Indicators value changes by year
Minimum:
-3.349
jan 1, 2010
Maximum:
29.467
jan 1, 2008
At the date of observation
Value
Absolute change
Change from previous value
jan 1, 2003
4.491
+4.491
0.0%
jan 1, 2004
9.762
+5.271
117.37%
jan 1, 2005
3.325
-6.438
-65.94%
jan 1, 2006
23.539
+20.214
607.99%
jan 1, 2007
27.202
+3.663
15.56%
jan 1, 2008
29.467
+2.265
8.33%
jan 1, 2009
18.347
-11.12
-37.74%
jan 1, 2010
-3.349
-21.696
-118.25%
jan 1, 2011
-3.179
+0.17
-5.07%
jan 1, 2012
2.656
+5.835
-183.54%
jan 1, 2013
3.316
+0.66
24.87%
jan 1, 2014
6.135
+2.819
85.0%
jan 1, 2015
7.239
+1.104
17.99%
jan 1, 2016
7.648
+0.409
5.65%
Ranking of countries by current statistics by years


Comments: