29
/
en
AIzaSyAYiBZKx7MnpbEhh9jyipgxe19OcubqV5w
April 1, 2024
147715
Guyana
GUY
true
2
1
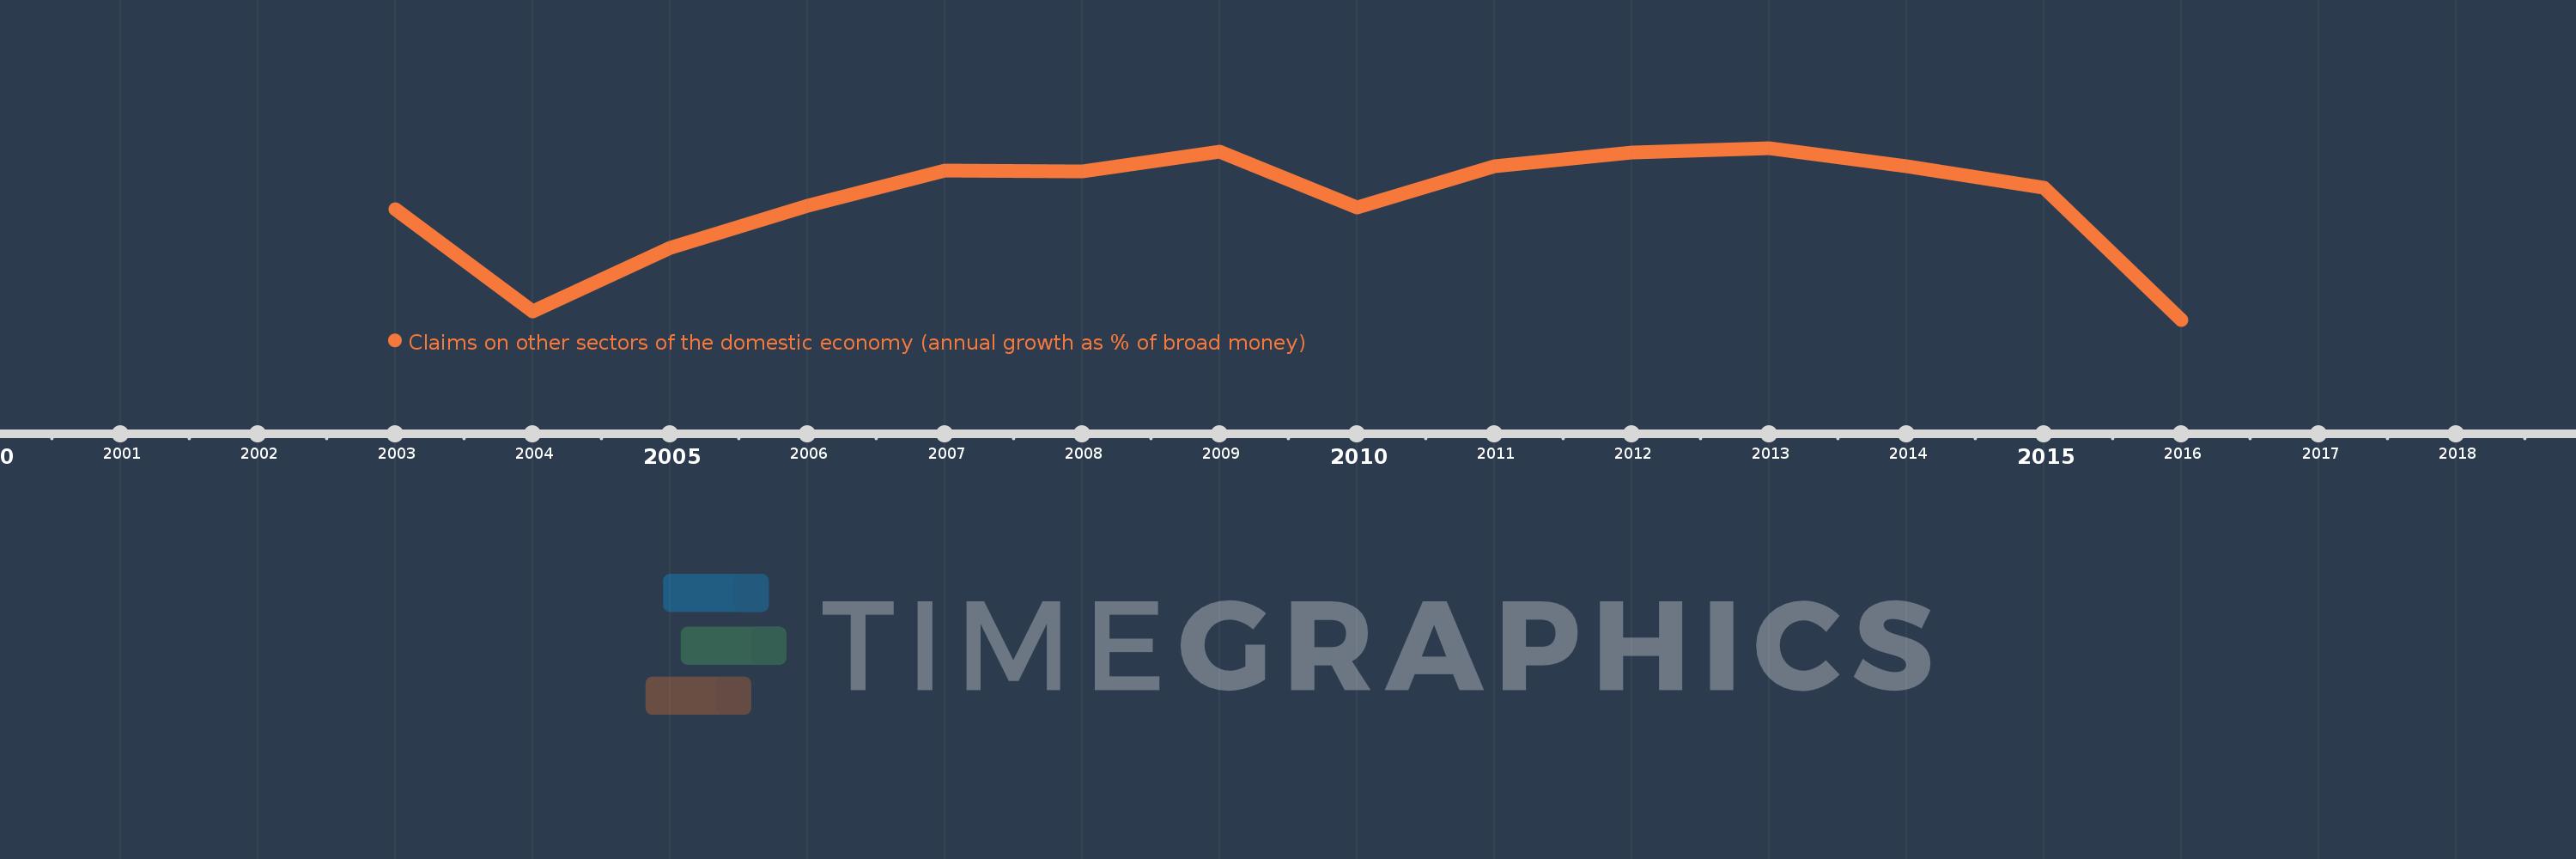
Claims on other sectors of the domestic economy (annual growth as % of broad money)
2016,2015,2014,2013,2012,2011,2010,2009,2008,2007,2006,2005,2004,2003
This statistics in other country:
Timeline:
This timeline shows a graph from 2003 to 2016 of Guyana. No data until 2002. Number of actual observations by date: 14.
Source name:
World Development Indicators
Source organization:
International Monetary Fund, International Financial Statistics and data files.
Categories, topics:
Financial Sector
Last updated:
apr 23, 2017
Indicators value changes by year
Minimum:
-7.499
jan 1, 2016
At the date of observation
Value
Absolute change
Change from previous value
jan 1, 2003
3.083
+3.083
0.0%
jan 1, 2004
-6.691
-9.774
-316.99%
jan 1, 2005
-0.569
+6.122
-91.49%
jan 1, 2006
3.455
+4.025
-707.04%
jan 1, 2007
6.821
+3.366
97.4%
jan 1, 2008
6.73
-0.091
-1.33%
jan 1, 2009
8.666
+1.936
28.77%
jan 1, 2010
3.276
-5.39
-62.19%
jan 1, 2011
7.228
+3.952
120.62%
jan 1, 2012
8.553
+1.325
18.33%
jan 1, 2013
9.0
+0.447
5.22%
jan 1, 2014
7.237
-1.763
-19.59%
jan 1, 2015
5.215
-2.022
-27.94%
jan 1, 2016
-7.499
-12.713
-243.79%
Ranking of countries by current statistics by years


Comments: