29
/
en
AIzaSyAYiBZKx7MnpbEhh9jyipgxe19OcubqV5w
April 1, 2024
103370
Chad
TCD
true
2
1
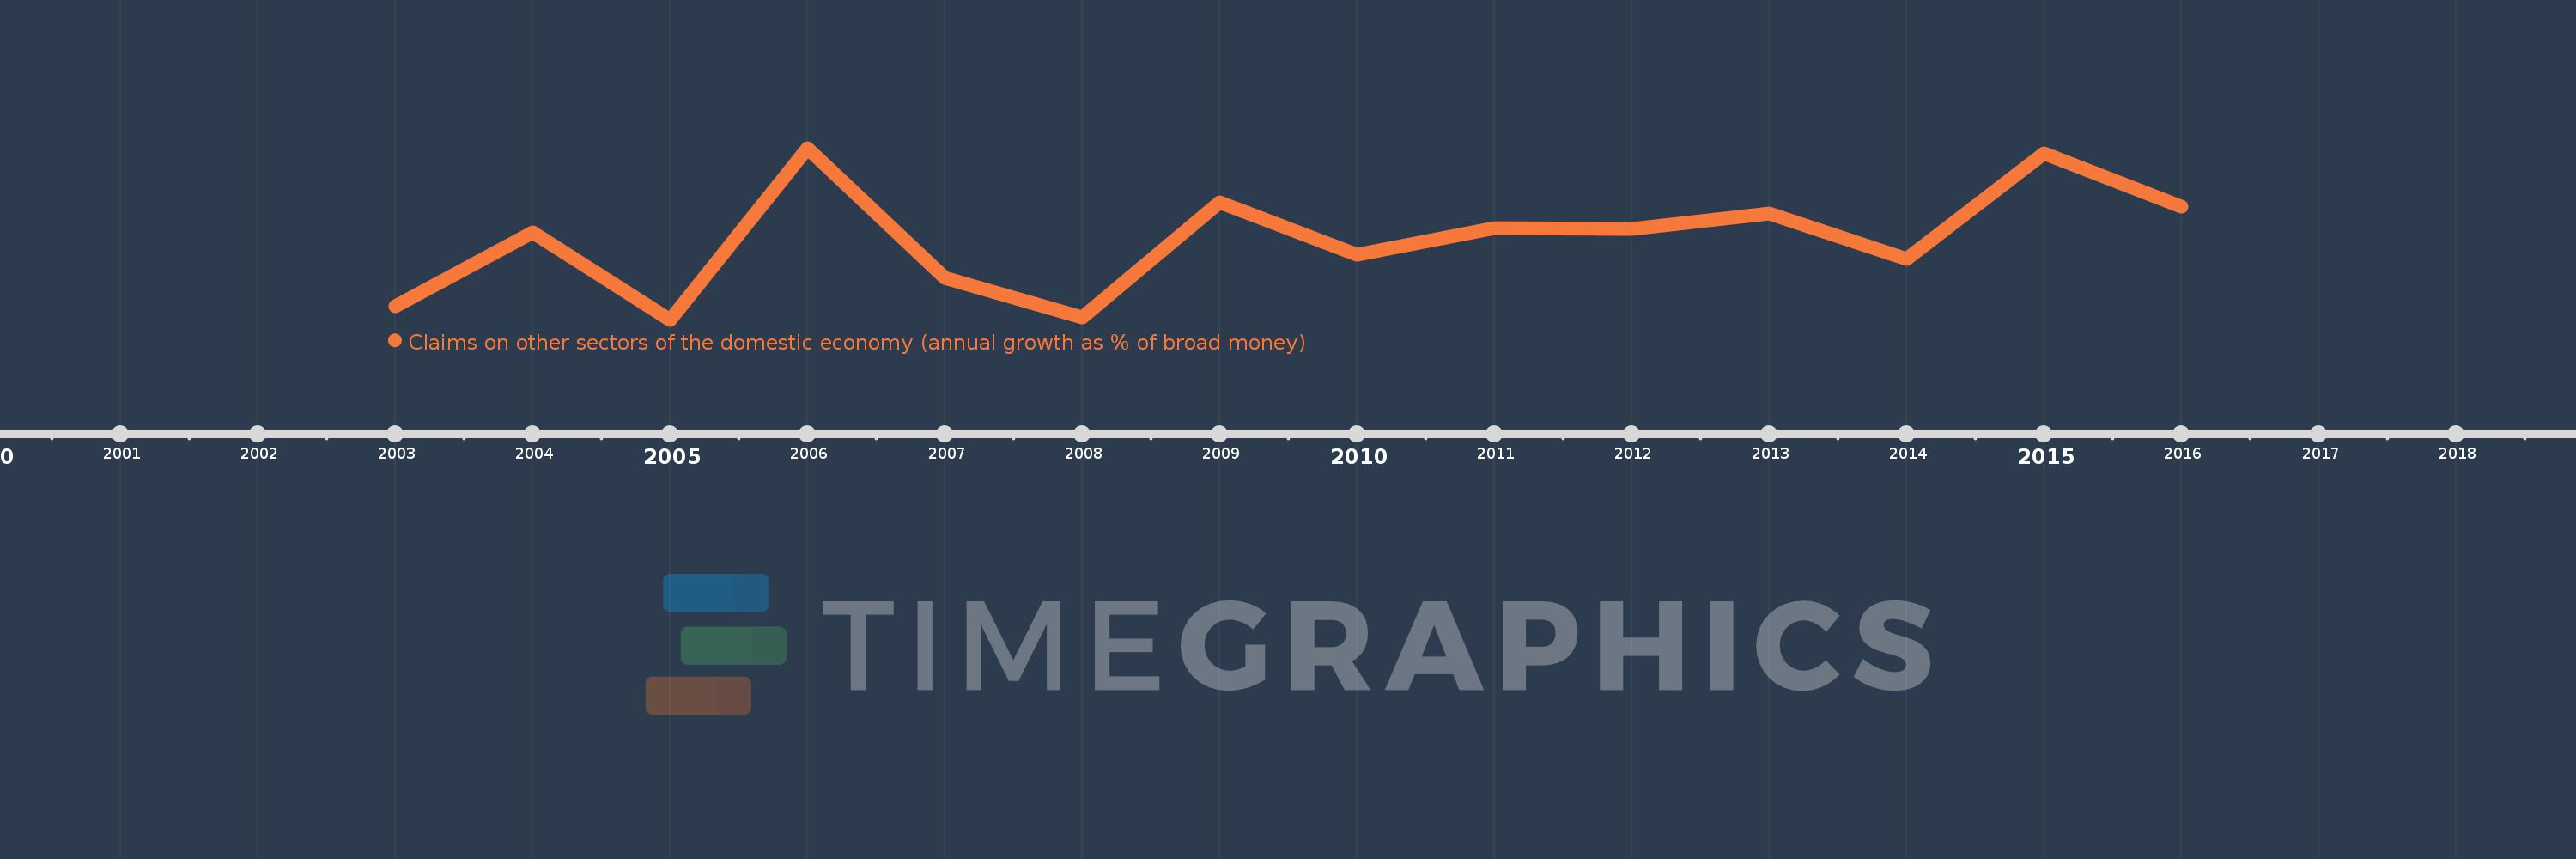
Claims on other sectors of the domestic economy (annual growth as % of broad money)
2016,2015,2014,2013,2012,2011,2010,2009,2008,2007,2006,2005,2004,2003
This statistics in other country:
Timeline:
This timeline shows a graph from 2003 to 2016 of Chad. No data until 2002. Number of actual observations by date: 14.
Source name:
World Development Indicators
Source organization:
International Monetary Fund, International Financial Statistics and data files.
Categories, topics:
Financial Sector
Last updated:
apr 23, 2017
Indicators value changes by year
Minimum:
-2.872
jan 1, 2005
Maximum:
20.082
jan 1, 2006
At the date of observation
Value
Absolute change
Change from previous value
jan 1, 2003
-1.079
-1.079
0.0%
jan 1, 2004
8.823
+9.902
-917.5%
jan 1, 2005
-2.872
-11.695
-132.56%
jan 1, 2006
20.082
+22.954
-799.15%
jan 1, 2007
2.748
-17.334
-86.32%
jan 1, 2008
-2.506
-5.254
-191.2%
jan 1, 2009
12.809
+15.315
-611.12%
jan 1, 2010
5.766
-7.043
-54.98%
jan 1, 2011
9.33
+3.564
61.81%
jan 1, 2012
9.224
-0.106
-1.14%
jan 1, 2013
11.351
+2.127
23.06%
jan 1, 2014
5.254
-6.097
-53.71%
jan 1, 2015
19.382
+14.128
268.9%
jan 1, 2016
12.2
-7.183
-37.06%
Ranking of countries by current statistics by years


Comments: