29
/
en
AIzaSyAYiBZKx7MnpbEhh9jyipgxe19OcubqV5w
April 1, 2024
127197
Equatorial Guinea
GNQ
true
2
1
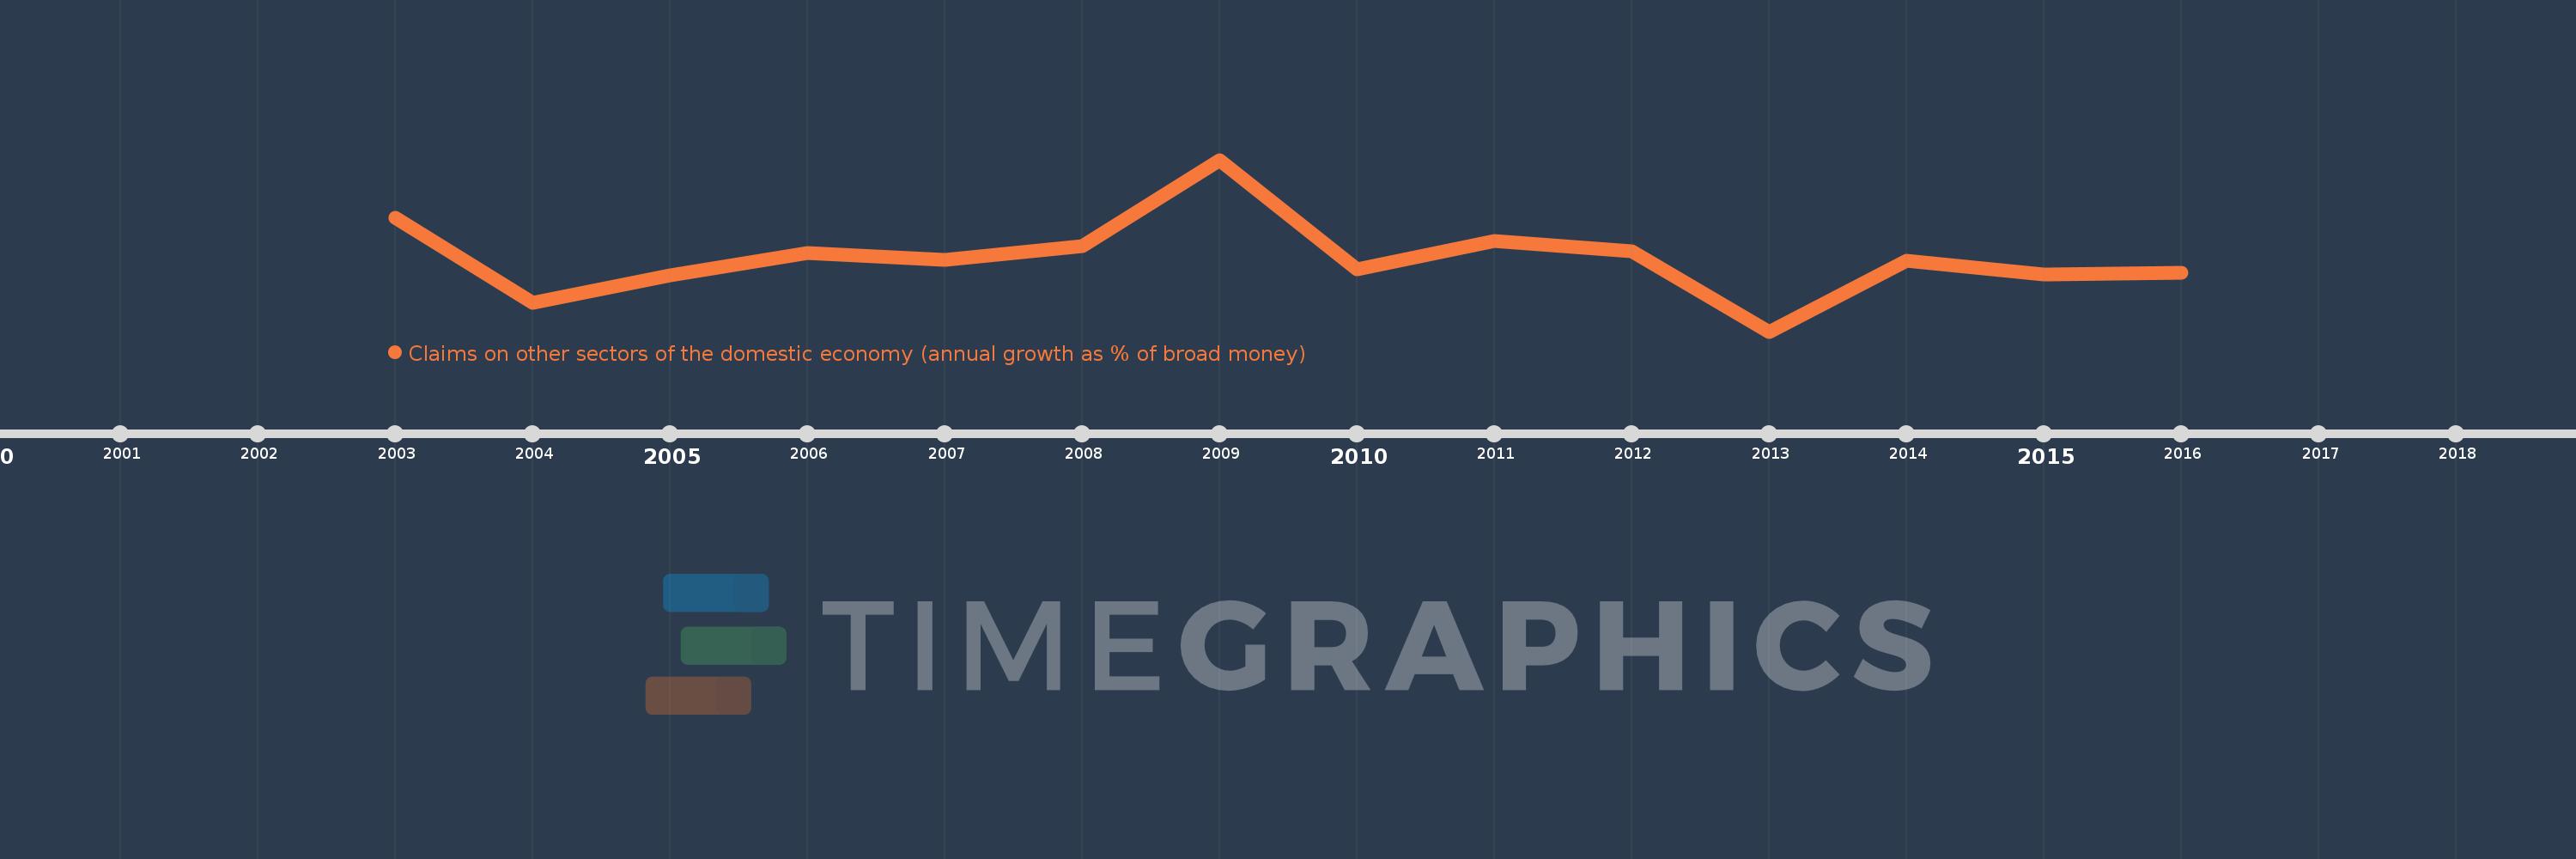
Claims on other sectors of the domestic economy (annual growth as % of broad money)
2016,2015,2014,2013,2012,2011,2010,2009,2008,2007,2006,2005,2004,2003
This statistics in other country:
Timeline:
This timeline shows a graph from 2003 to 2016 of Equatorial Guinea. No data until 2002. Number of actual observations by date: 14.
Source name:
World Development Indicators
Source organization:
International Monetary Fund, International Financial Statistics and data files.
Categories, topics:
Financial Sector
Last updated:
apr 23, 2017
Indicators value changes by year
Minimum:
-10.911
jan 1, 2013
At the date of observation
Value
Absolute change
Change from previous value
jan 1, 2003
26.675
+26.675
0.0%
jan 1, 2004
-1.338
-28.013
-105.02%
jan 1, 2005
7.565
+8.903
-665.41%
jan 1, 2006
15.028
+7.464
98.66%
jan 1, 2007
12.823
-2.206
-14.68%
jan 1, 2008
17.368
+4.546
35.45%
jan 1, 2009
45.87
+28.502
164.11%
jan 1, 2010
9.673
-36.198
-78.91%
jan 1, 2011
19.1
+9.428
97.46%
jan 1, 2012
15.727
-3.373
-17.66%
jan 1, 2013
-10.911
-26.638
-169.38%
jan 1, 2014
12.505
+23.416
-214.61%
jan 1, 2015
7.994
-4.512
-36.08%
jan 1, 2016
8.671
+0.677
8.47%
Ranking of countries by current statistics by years


Comments: