29
/
en
AIzaSyAYiBZKx7MnpbEhh9jyipgxe19OcubqV5w
April 1, 2024
212713
Nigeria
NGA
true
2
1
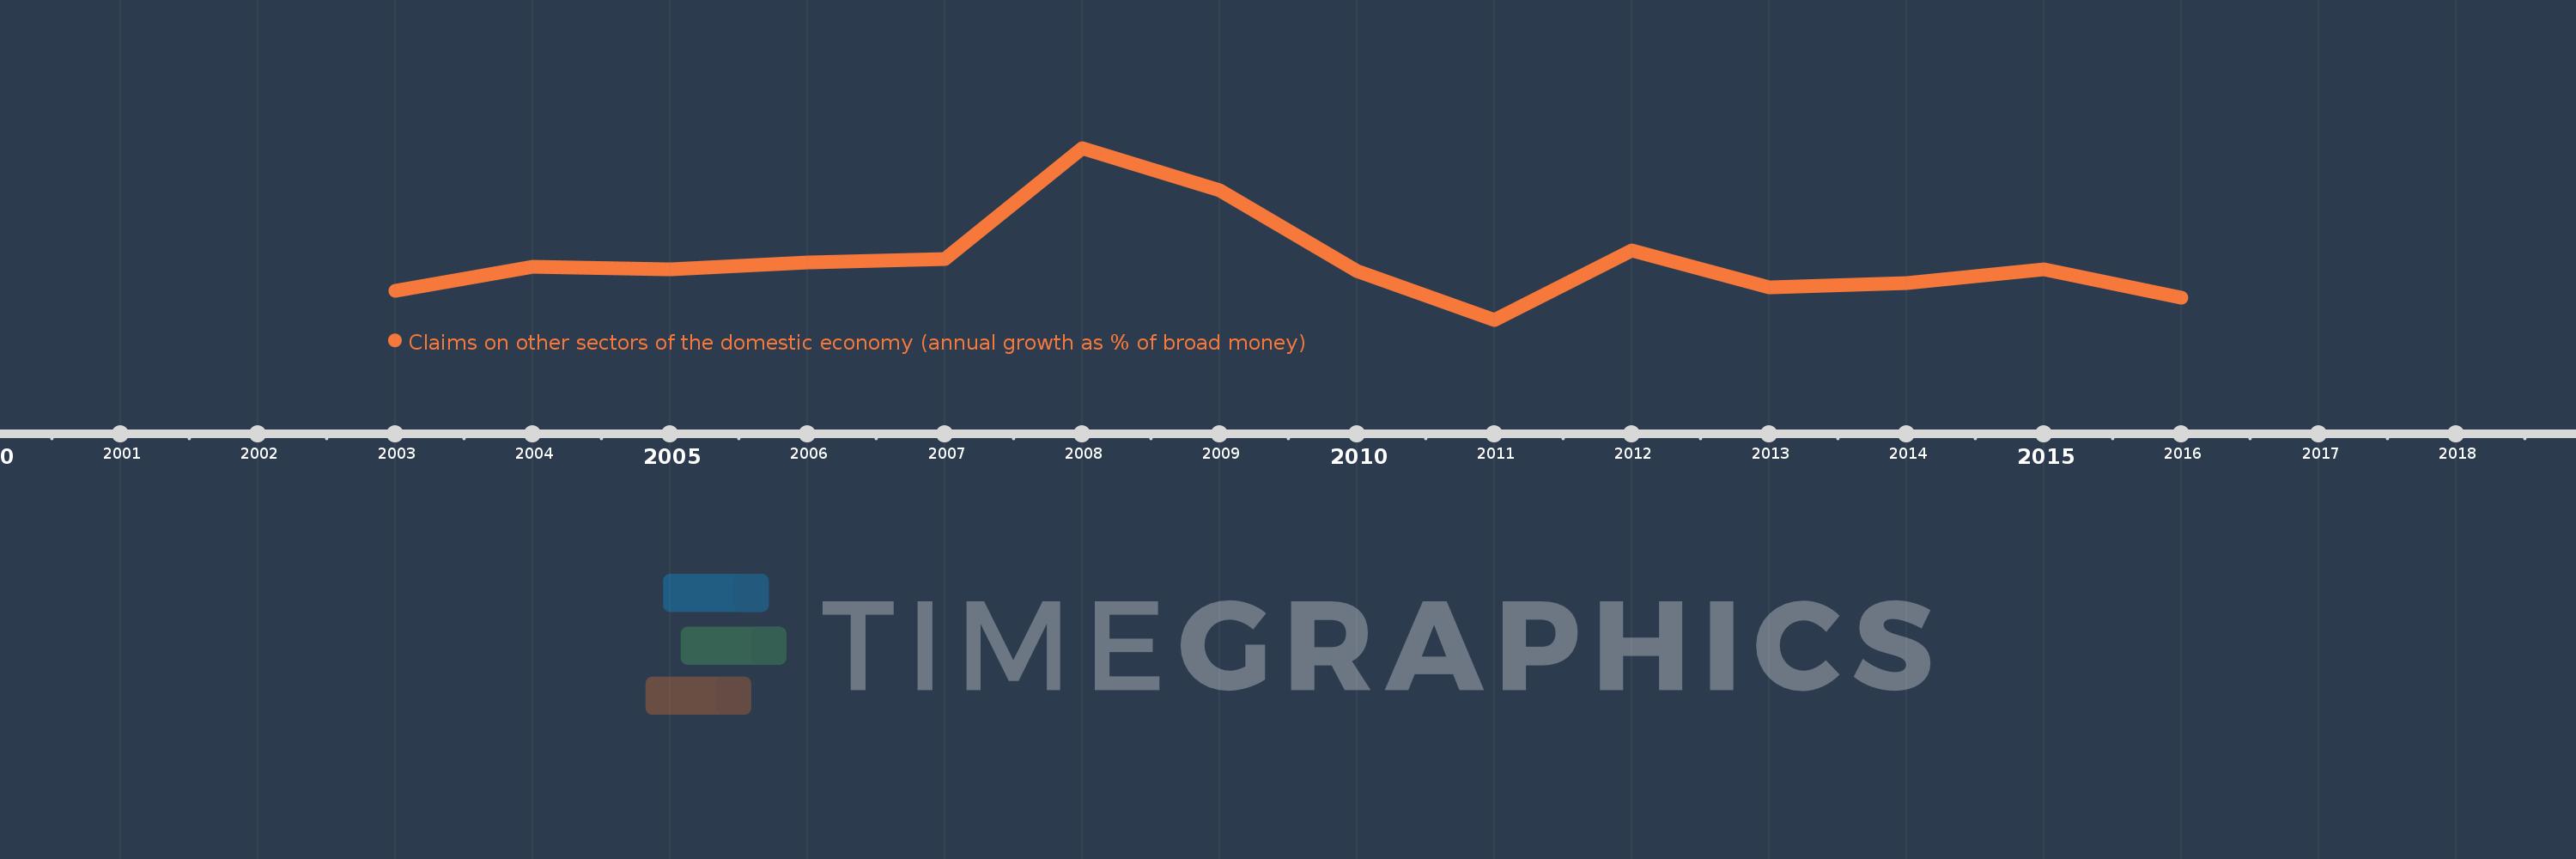
Claims on other sectors of the domestic economy (annual growth as % of broad money)
2016,2015,2014,2013,2012,2011,2010,2009,2008,2007,2006,2005,2004,2003
This statistics in other country:
Timeline:
This timeline shows a graph from 2003 to 2016 of Nigeria. No data until 2002. Number of actual observations by date: 14.
Source name:
World Development Indicators
Source organization:
International Monetary Fund, International Financial Statistics and data files.
Categories, topics:
Financial Sector
Last updated:
apr 23, 2017
Indicators value changes by year
Minimum:
-11.248
jan 1, 2011
Maximum:
88.298
jan 1, 2008
At the date of observation
Value
Absolute change
Change from previous value
jan 1, 2003
5.751
+5.751
0.0%
jan 1, 2004
19.54
+13.79
239.79%
jan 1, 2005
17.753
-1.787
-9.15%
jan 1, 2006
21.88
+4.127
23.25%
jan 1, 2007
23.955
+2.075
9.48%
jan 1, 2008
88.298
+64.343
268.6%
jan 1, 2009
63.917
-24.381
-27.61%
jan 1, 2010
16.921
-46.996
-73.53%
jan 1, 2011
-11.248
-28.169
-166.47%
jan 1, 2012
29.002
+40.25
-357.85%
jan 1, 2013
7.437
-21.565
-74.36%
jan 1, 2014
9.887
+2.45
32.94%
jan 1, 2015
17.799
+7.913
80.03%
jan 1, 2016
1.671
-16.128
-90.61%
Ranking of countries by current statistics by years


Comments: