29
/
en
AIzaSyAYiBZKx7MnpbEhh9jyipgxe19OcubqV5w
April 1, 2024
188782
Maldives
MDV
true
2
1
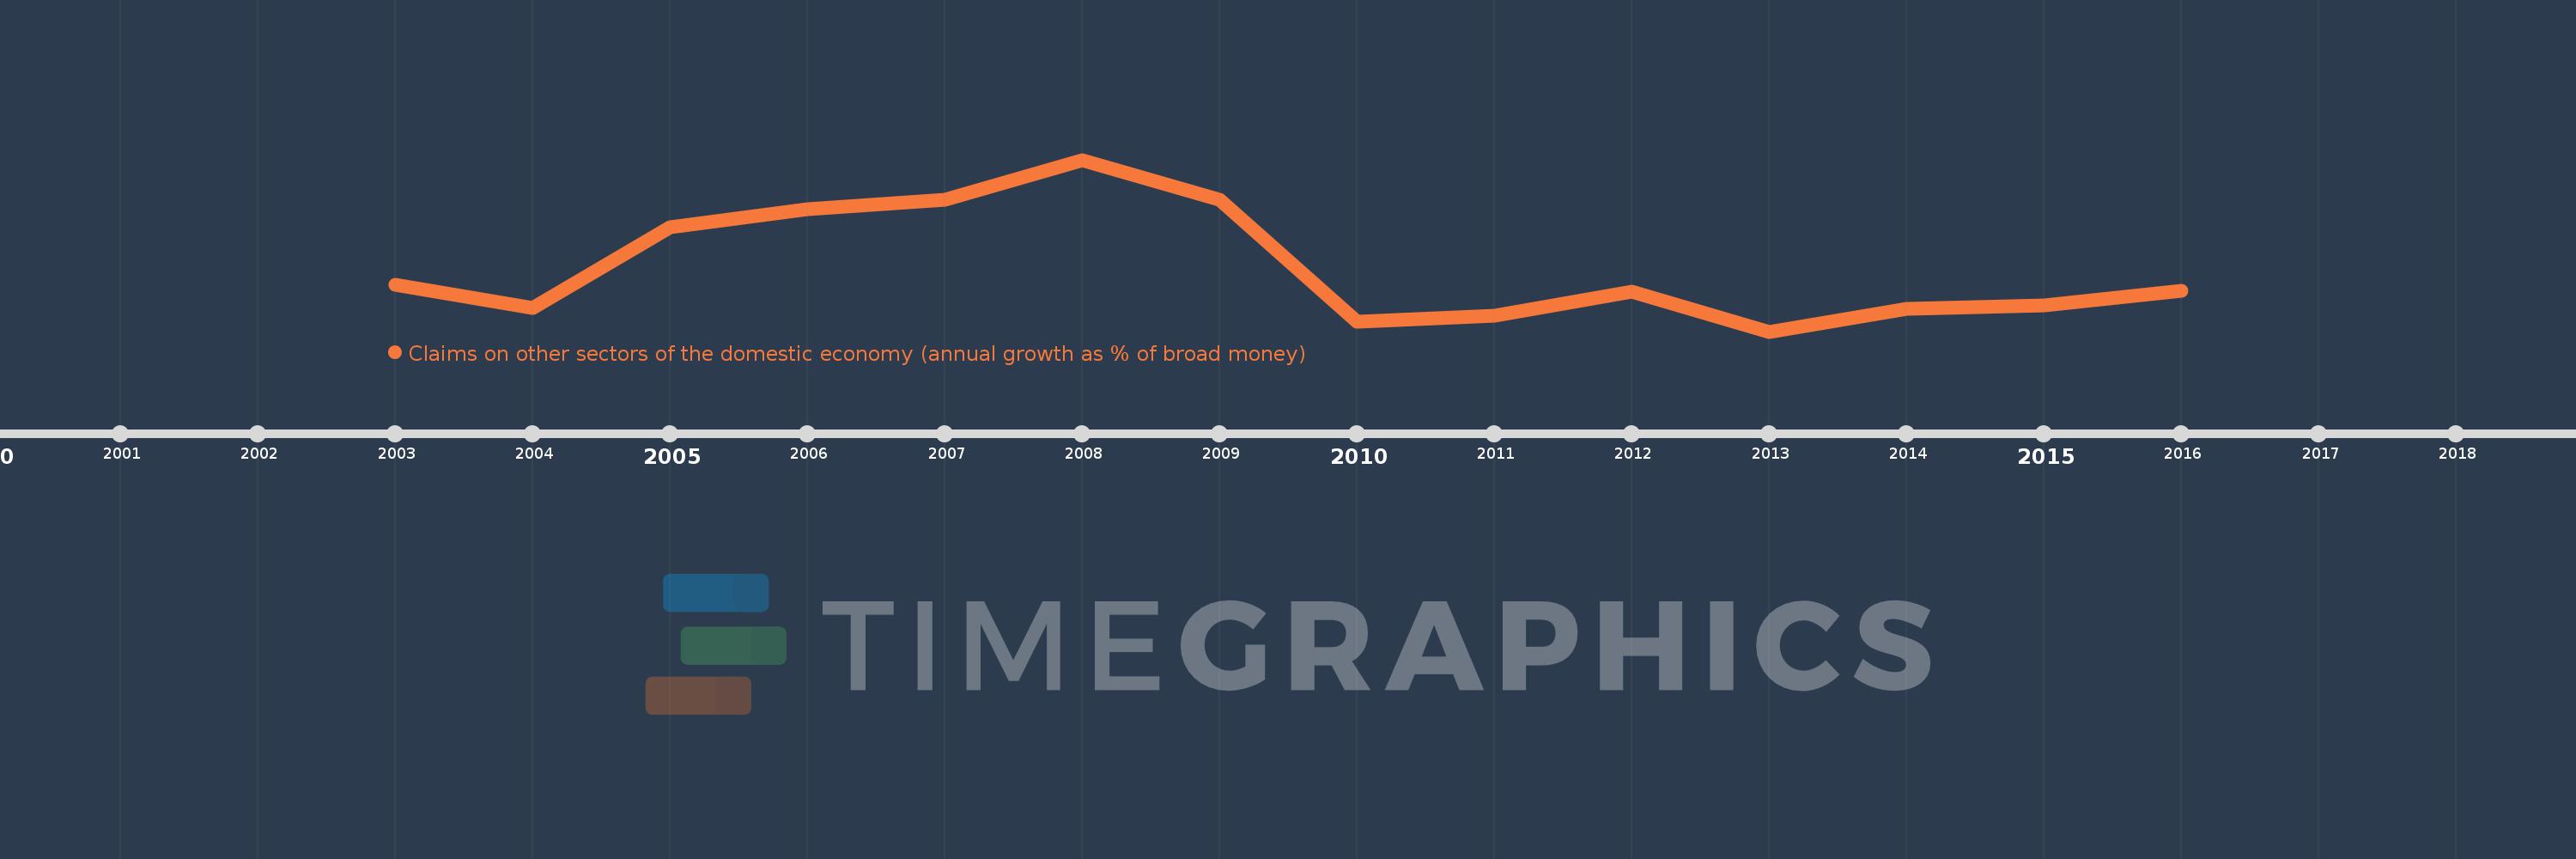
Claims on other sectors of the domestic economy (annual growth as % of broad money)
2016,2015,2014,2013,2012,2011,2010,2009,2008,2007,2006,2005,2004,2003
This statistics in other country:
Timeline:
This timeline shows a graph from 2003 to 2016 of Maldives. No data until 2002. Number of actual observations by date: 14.
Source name:
World Development Indicators
Source organization:
International Monetary Fund, International Financial Statistics and data files.
Categories, topics:
Financial Sector
Last updated:
apr 23, 2017
Indicators value changes by year
Minimum:
-8.464
jan 1, 2013
Maximum:
57.206
jan 1, 2008
At the date of observation
Value
Absolute change
Change from previous value
jan 1, 2003
9.432
+9.432
0.0%
jan 1, 2004
0.581
-8.852
-93.84%
jan 1, 2005
31.416
+30.835
5.31K%
jan 1, 2006
38.46
+7.045
22.42%
jan 1, 2007
41.886
+3.426
8.91%
jan 1, 2008
57.206
+15.319
36.57%
jan 1, 2009
41.874
-15.332
-26.8%
jan 1, 2010
-4.699
-46.573
-111.22%
jan 1, 2011
-2.34
+2.359
-50.2%
jan 1, 2012
6.654
+8.995
-384.35%
jan 1, 2013
-8.464
-15.119
-227.19%
jan 1, 2014
0.388
+8.852
-104.58%
jan 1, 2015
1.679
+1.291
333.22%
jan 1, 2016
7.015
+5.336
317.81%
Ranking of countries by current statistics by years


Comments: