29
/
en
AIzaSyAYiBZKx7MnpbEhh9jyipgxe19OcubqV5w
April 1, 2024
216143
Pakistan
PAK
true
2
1
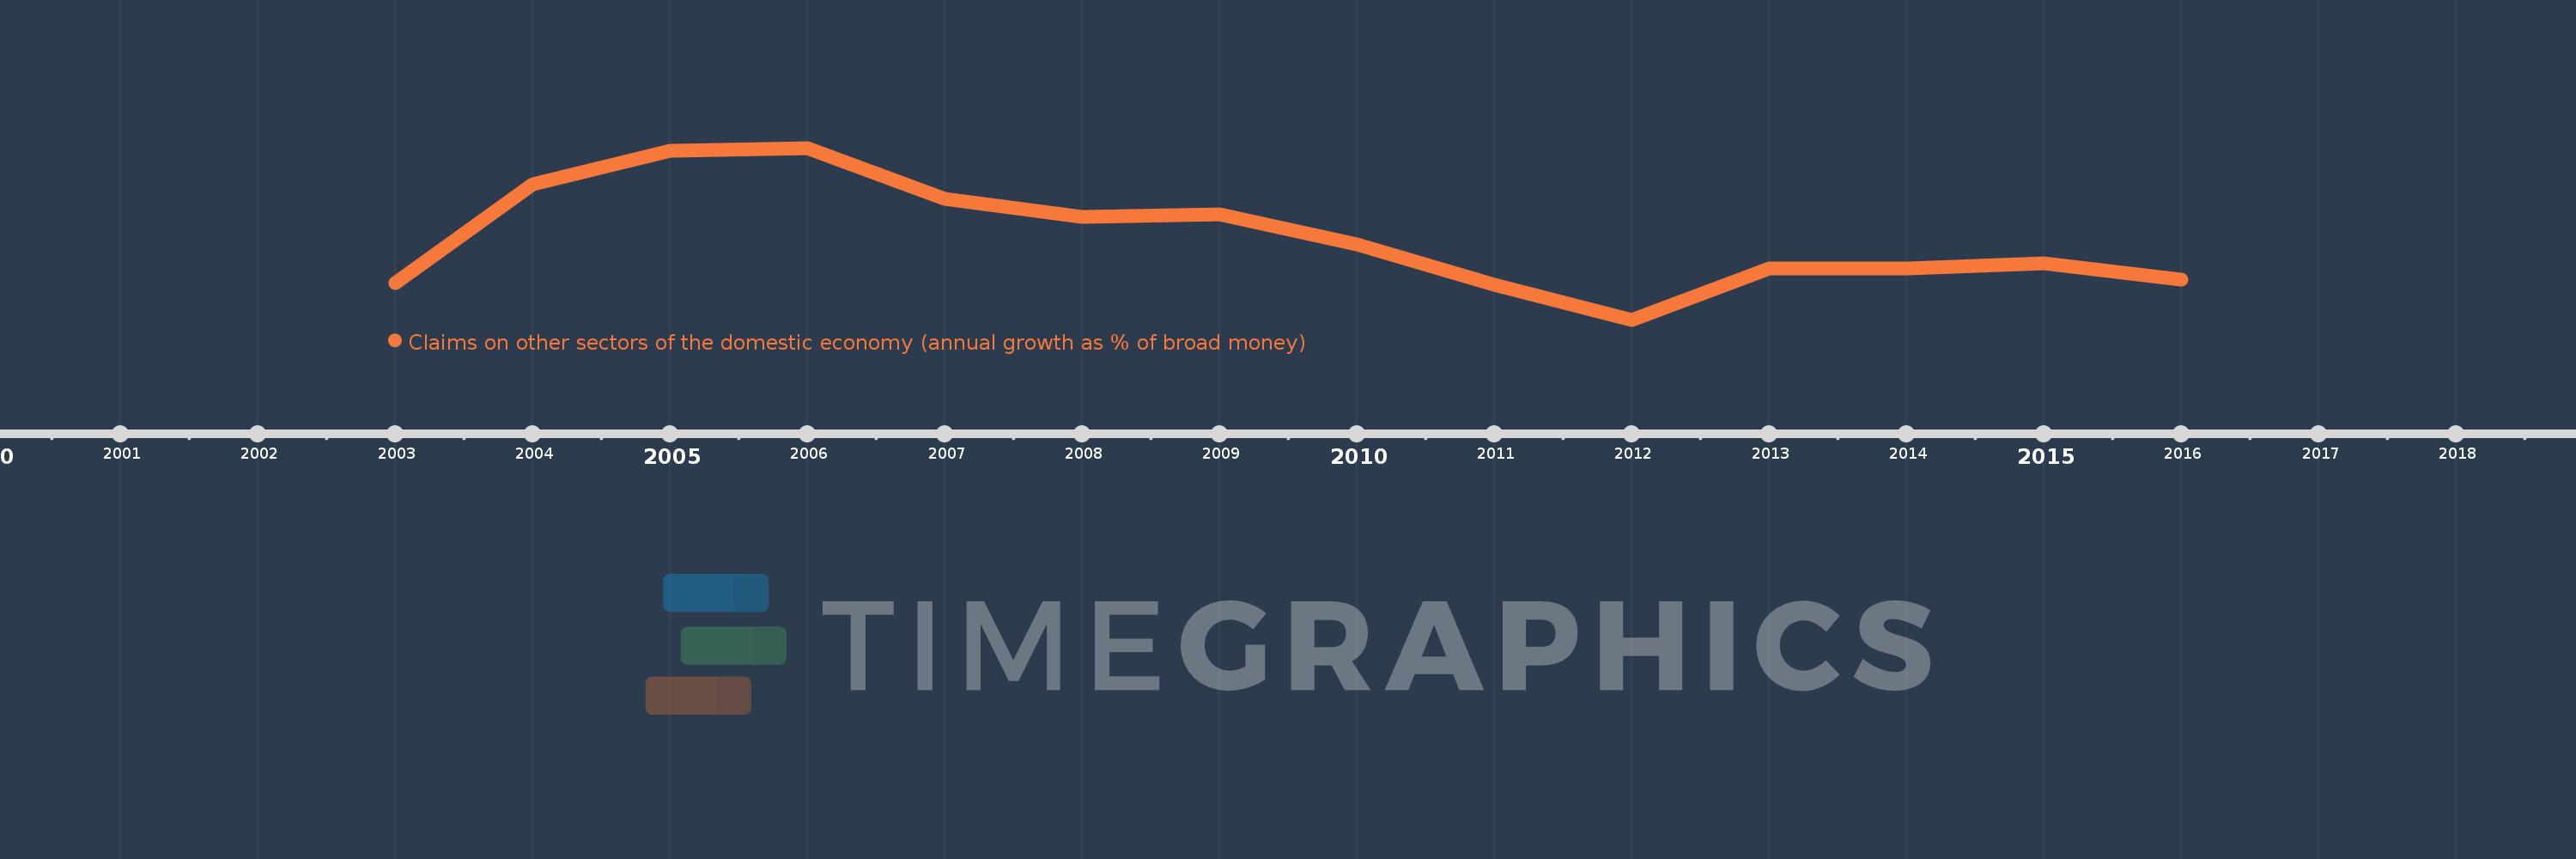
Claims on other sectors of the domestic economy (annual growth as % of broad money)
2016,2015,2014,2013,2012,2011,2010,2009,2008,2007,2006,2005,2004,2003
This statistics in other country:
Timeline:
This timeline shows a graph from 2003 to 2016 of Pakistan. No data until 2002. Number of actual observations by date: 14.
Source name:
World Development Indicators
Source organization:
International Monetary Fund, International Financial Statistics and data files.
Categories, topics:
Financial Sector
Last updated:
apr 23, 2017
Indicators value changes by year
Minimum:
-2.088
jan 1, 2012
Maximum:
17.262
jan 1, 2006
At the date of observation
Value
Absolute change
Change from previous value
jan 1, 2003
2.009
+2.009
0.0%
jan 1, 2004
13.142
+11.133
554.23%
jan 1, 2005
16.914
+3.772
28.7%
jan 1, 2006
17.262
+0.348
2.06%
jan 1, 2007
11.539
-5.723
-33.16%
jan 1, 2008
9.475
-2.064
-17.89%
jan 1, 2009
9.755
+0.28
2.96%
jan 1, 2010
6.404
-3.351
-34.35%
jan 1, 2011
1.821
-4.582
-71.56%
jan 1, 2012
-2.088
-3.91
-214.65%
jan 1, 2013
3.66
+5.748
-275.27%
jan 1, 2014
3.706
+0.046
1.25%
jan 1, 2015
4.276
+0.57
15.39%
jan 1, 2016
2.46
-1.816
-42.46%
Ranking of countries by current statistics by years


Comments: