29
/
en
AIzaSyAYiBZKx7MnpbEhh9jyipgxe19OcubqV5w
April 1, 2024
205048
Namibia
NAM
true
2
1
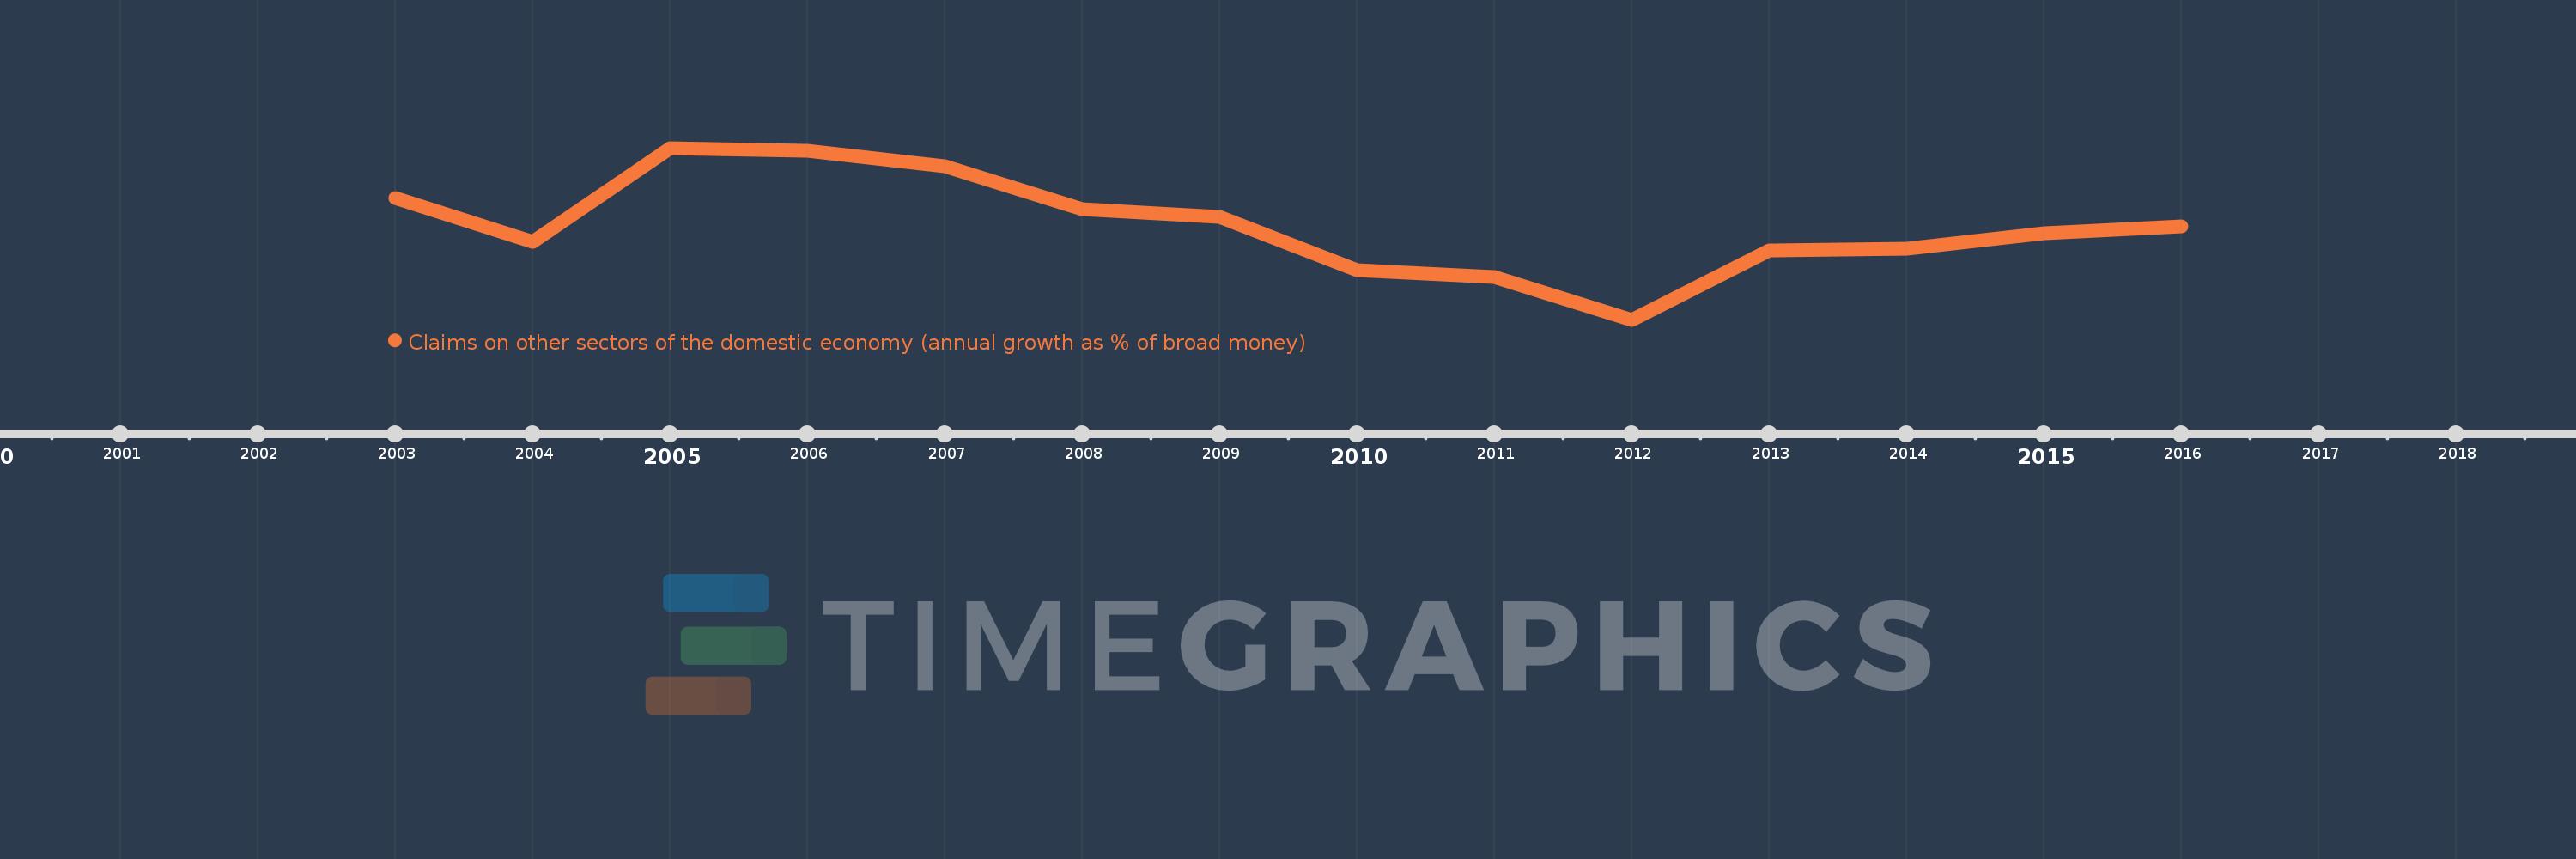
Claims on other sectors of the domestic economy (annual growth as % of broad money)
2016,2015,2014,2013,2012,2011,2010,2009,2008,2007,2006,2005,2004,2003
This statistics in other country:
Timeline:
This timeline shows a graph from 2003 to 2016 of Namibia. No data until 2002. Number of actual observations by date: 14.
Source name:
World Development Indicators
Source organization:
International Monetary Fund, International Financial Statistics and data files.
Categories, topics:
Financial Sector
Last updated:
apr 23, 2017
Indicators value changes by year
Maximum:
25.379
jan 1, 2005
At the date of observation
Value
Absolute change
Change from previous value
jan 1, 2003
19.395
+19.395
0.0%
jan 1, 2004
14.125
-5.269
-27.17%
jan 1, 2005
25.379
+11.254
79.67%
jan 1, 2006
25.068
-0.311
-1.23%
jan 1, 2007
23.142
-1.926
-7.68%
jan 1, 2008
18.082
-5.06
-21.86%
jan 1, 2009
17.155
-0.927
-5.13%
jan 1, 2010
10.669
-6.485
-37.8%
jan 1, 2011
9.904
-0.765
-7.17%
jan 1, 2012
4.771
-5.133
-51.83%
jan 1, 2013
13.076
+8.305
174.06%
jan 1, 2014
13.259
+0.183
1.4%
jan 1, 2015
15.177
+1.918
14.47%
jan 1, 2016
15.949
+0.771
5.08%
Ranking of countries by current statistics by years


Comments: