29
/
en
AIzaSyAYiBZKx7MnpbEhh9jyipgxe19OcubqV5w
April 1, 2024
253938
Suriname
SUR
true
2
1
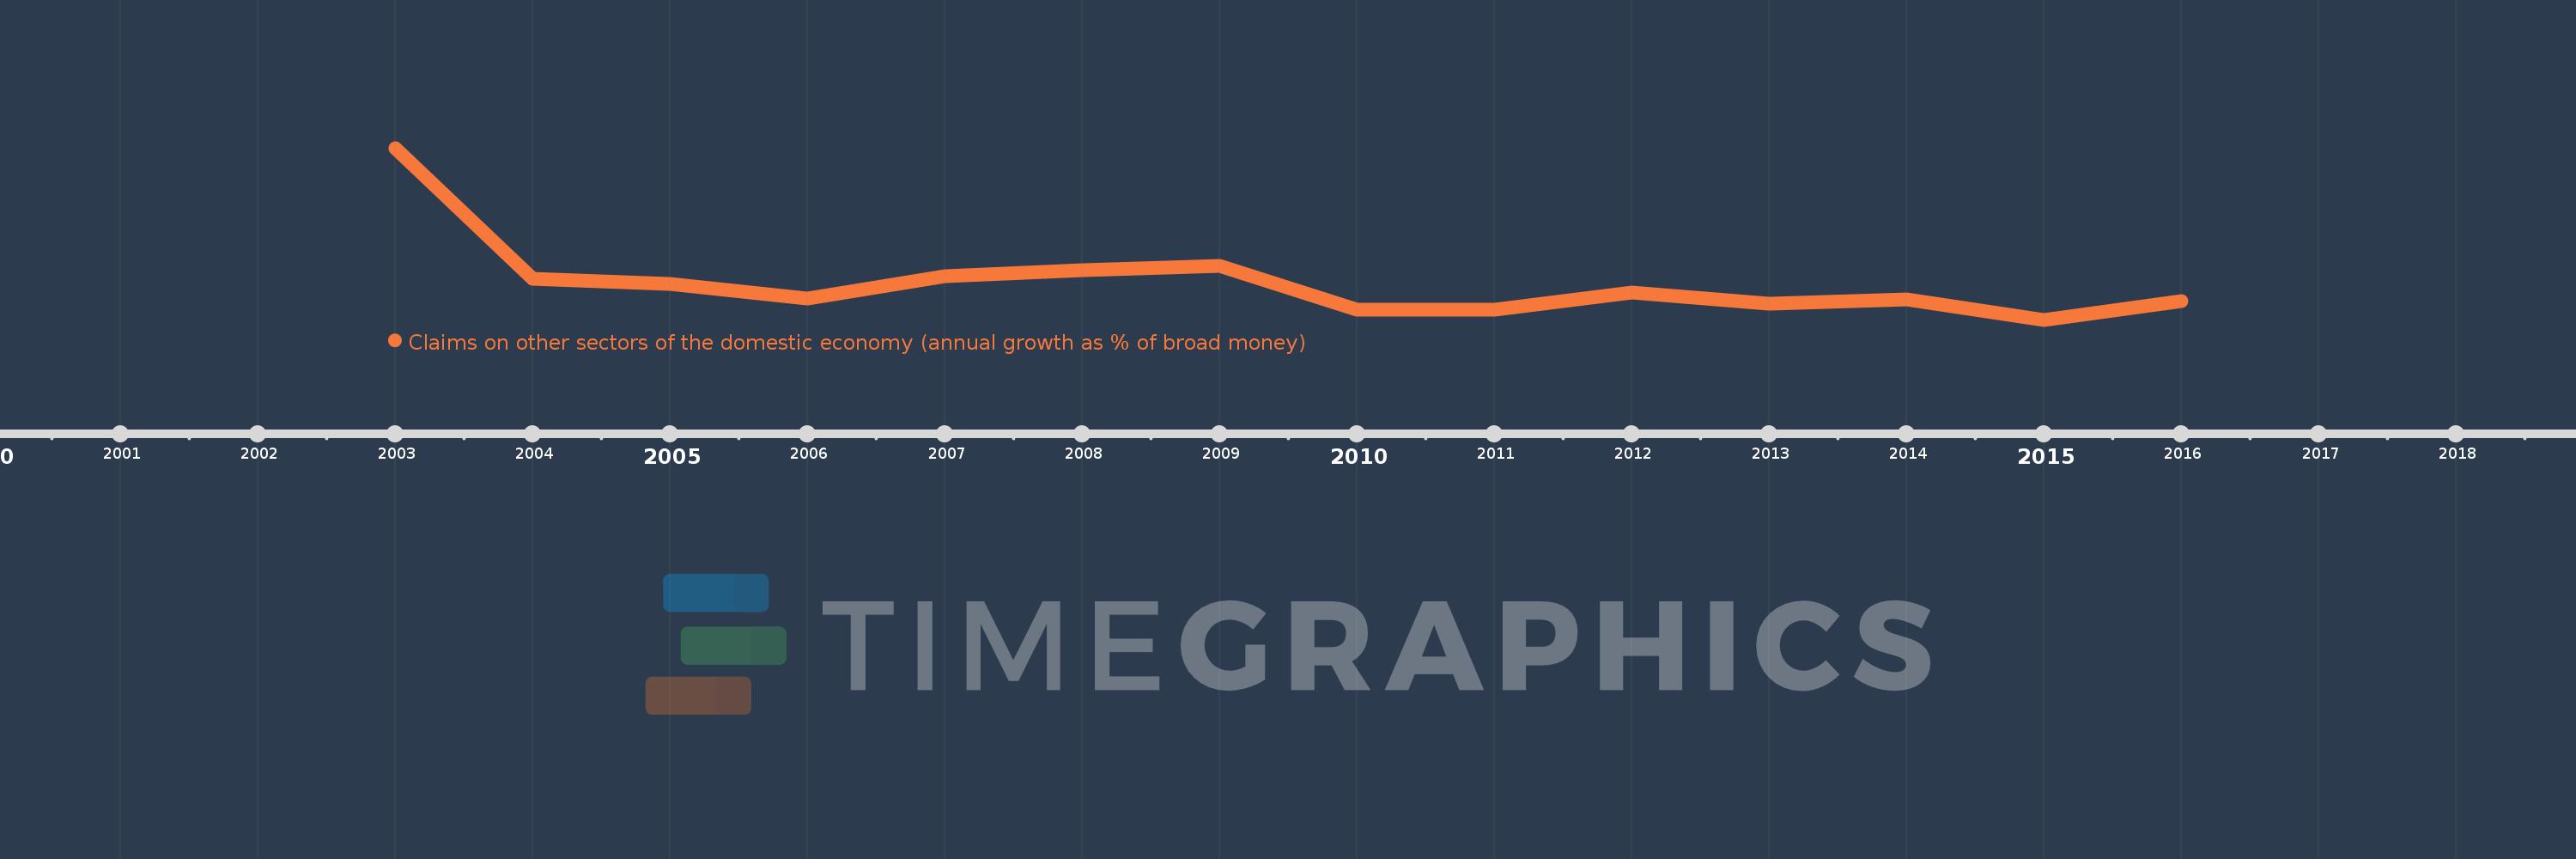
Claims on other sectors of the domestic economy (annual growth as % of broad money)
2016,2015,2014,2013,2012,2011,2010,2009,2008,2007,2006,2005,2004,2003
This statistics in other country:
Timeline:
This timeline shows a graph from 2003 to 2016 of Suriname. No data until 2002. Number of actual observations by date: 14.
Source name:
World Development Indicators
Source organization:
International Monetary Fund, International Financial Statistics and data files.
Categories, topics:
Financial Sector
Last updated:
apr 23, 2017
Indicators value changes by year
Maximum:
44.988
jan 1, 2003
At the date of observation
Value
Absolute change
Change from previous value
jan 1, 2003
44.988
+44.988
0.0%
jan 1, 2004
14.226
-30.763
-68.38%
jan 1, 2005
13.055
-1.17
-8.23%
jan 1, 2006
9.567
-3.488
-26.72%
jan 1, 2007
14.967
+5.4
56.44%
jan 1, 2008
16.369
+1.402
9.37%
jan 1, 2009
17.367
+0.998
6.09%
jan 1, 2010
6.96
-10.406
-59.92%
jan 1, 2011
6.974
+0.013
0.19%
jan 1, 2012
11.043
+4.069
58.36%
jan 1, 2013
8.503
-2.54
-23.0%
jan 1, 2014
9.414
+0.911
10.72%
jan 1, 2015
4.675
-4.739
-50.34%
jan 1, 2016
8.997
+4.322
92.45%
Ranking of countries by current statistics by years


Comments: