29
/
en
AIzaSyAYiBZKx7MnpbEhh9jyipgxe19OcubqV5w
April 1, 2024
167212
Kenya
KEN
true
2
1
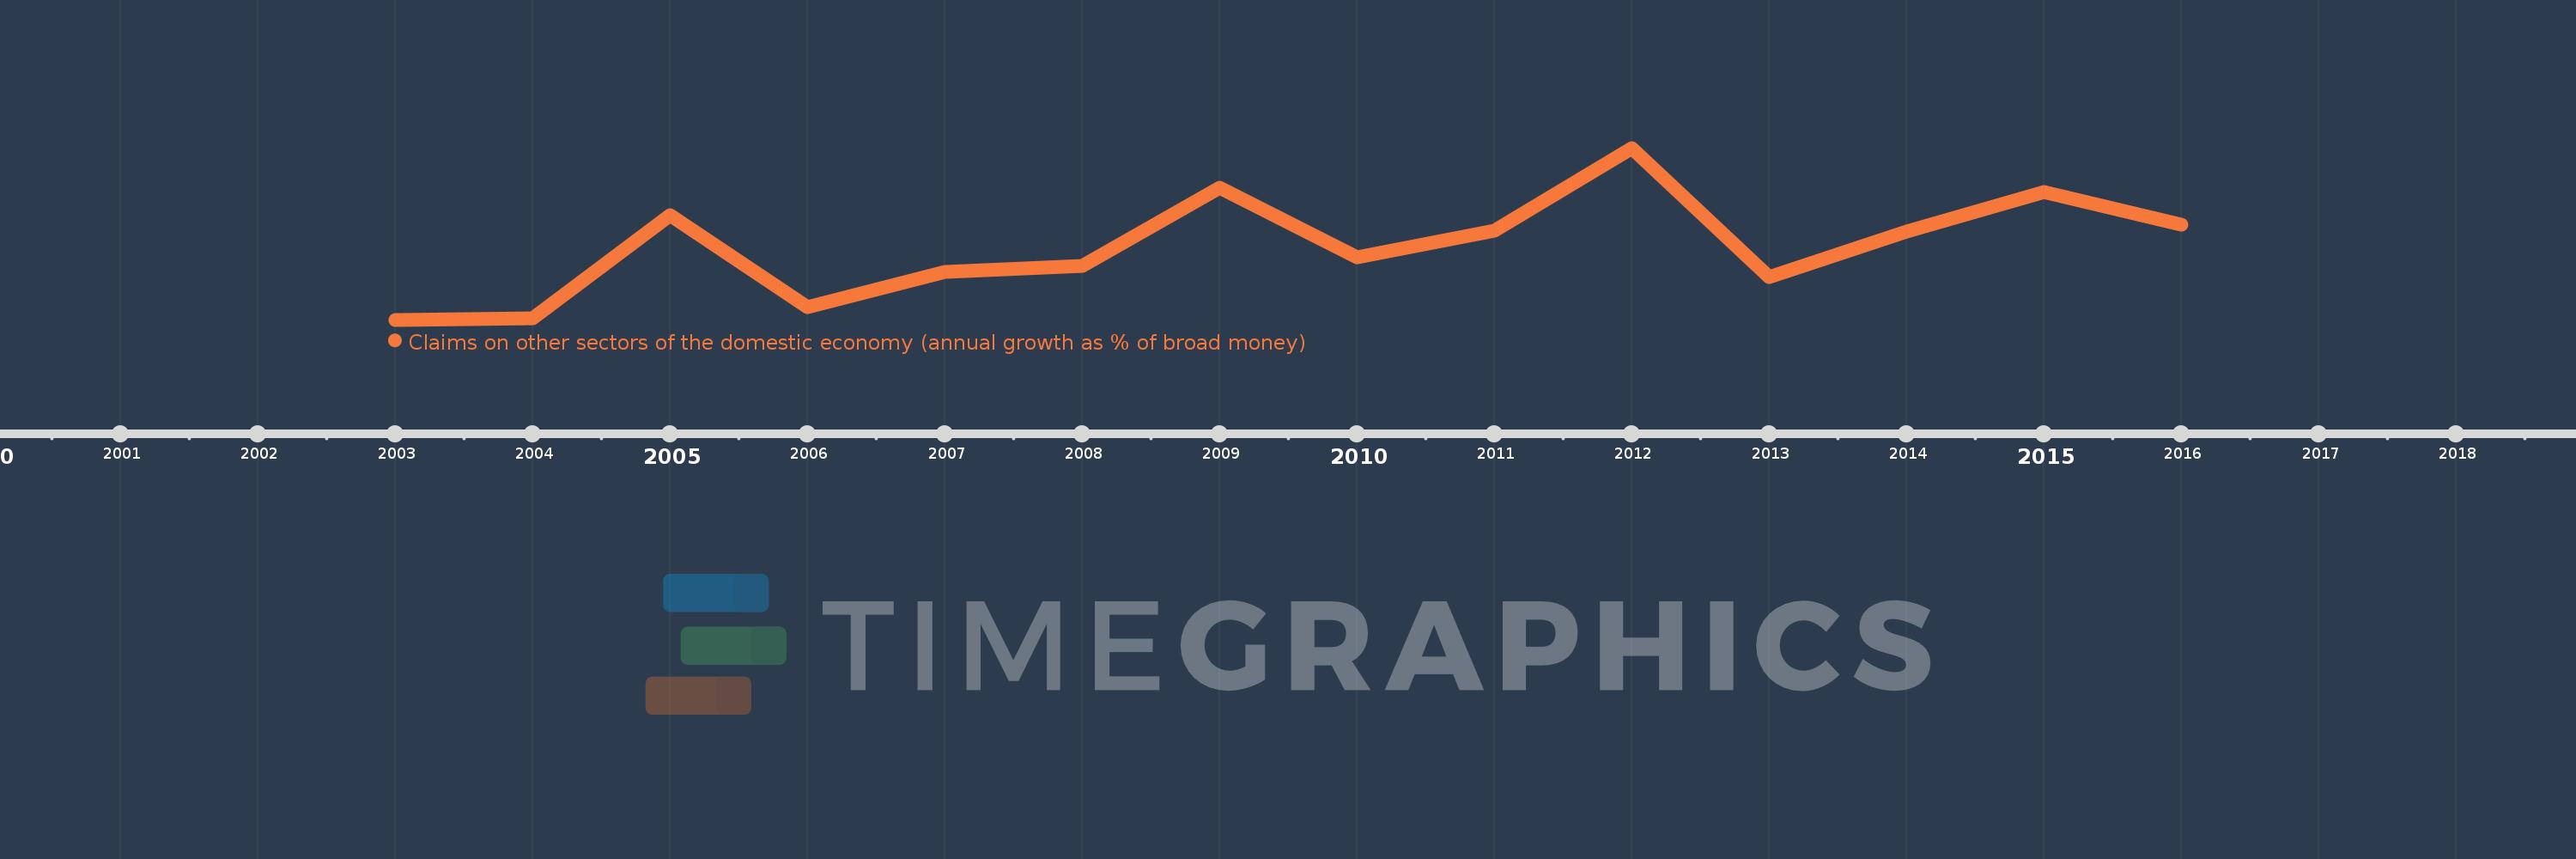
Claims on other sectors of the domestic economy (annual growth as % of broad money)
2016,2015,2014,2013,2012,2011,2010,2009,2008,2007,2006,2005,2004,2003
This statistics in other country:
Timeline:
This timeline shows a graph from 2003 to 2016 of Kenya. No data until 2002. Number of actual observations by date: 14.
Source name:
World Development Indicators
Source organization:
International Monetary Fund, International Financial Statistics and data files.
Categories, topics:
Financial Sector
Last updated:
apr 23, 2017
Indicators value changes by year
Maximum:
23.333
jan 1, 2012
At the date of observation
Value
Absolute change
Change from previous value
jan 1, 2003
4.697
+4.697
0.0%
jan 1, 2004
4.845
+0.148
3.14%
jan 1, 2005
16.004
+11.159
230.32%
jan 1, 2006
6.042
-9.962
-62.25%
jan 1, 2007
9.887
+3.845
63.64%
jan 1, 2008
10.526
+0.639
6.46%
jan 1, 2009
19.04
+8.515
80.9%
jan 1, 2010
11.515
-7.525
-39.52%
jan 1, 2011
14.316
+2.8
24.32%
jan 1, 2012
23.333
+9.017
62.99%
jan 1, 2013
9.314
-14.018
-60.08%
jan 1, 2014
14.258
+4.943
53.07%
jan 1, 2015
18.599
+4.341
30.45%
jan 1, 2016
14.988
-3.611
-19.41%
Ranking of countries by current statistics by years


Comments: