29
/
en
AIzaSyAYiBZKx7MnpbEhh9jyipgxe19OcubqV5w
April 1, 2024
74367
Austria
AUT
true
2
1
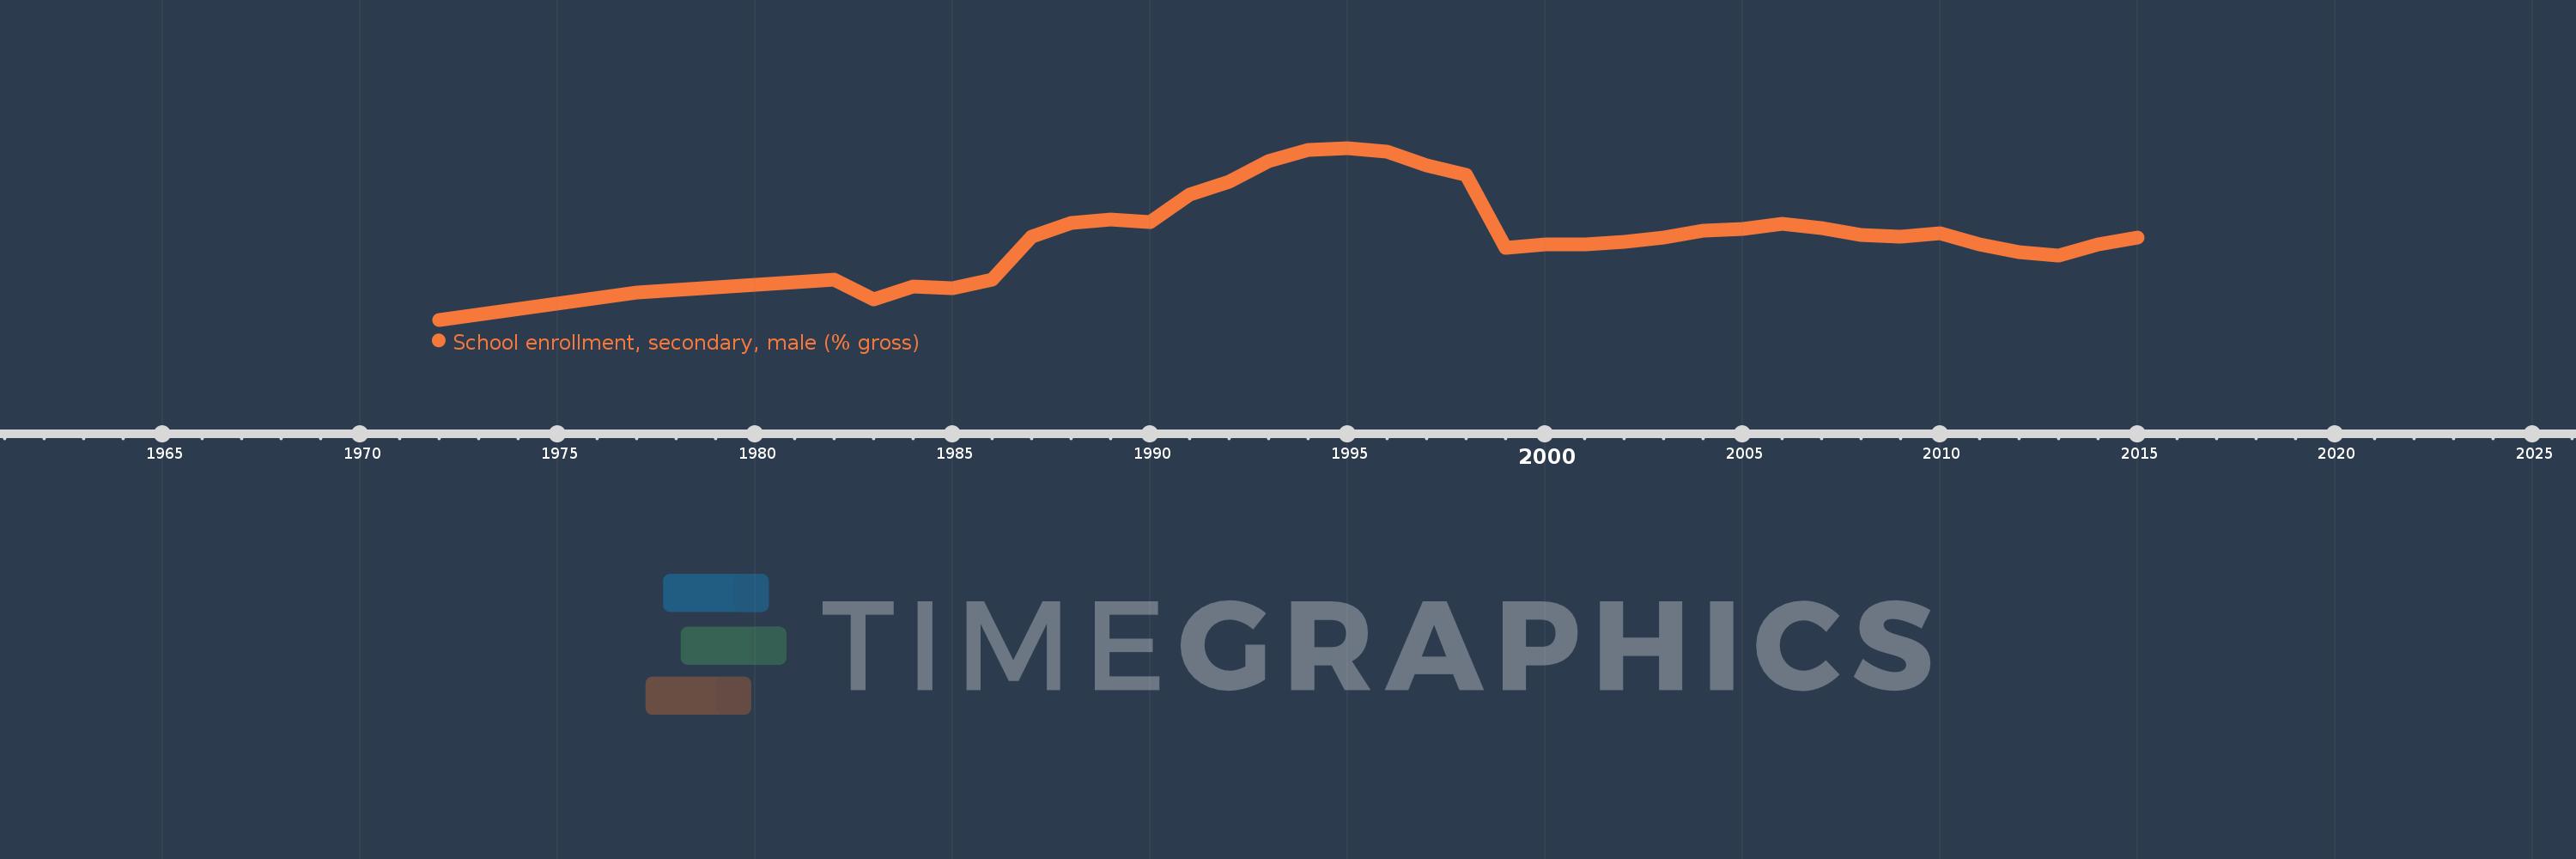
School enrollment, secondary, male (% gross)
2015,2014,2013,2012,2011,2010,2009,2008,2007,2006,2005,2004,2003,2002,2001,2000,1999,1998,1997,1996,1995,1994,1993,1992,1991,1990,1989,1988,1987,1986,1985,1984,1983,1982,1977,1972
This statistics in other country:
AfghanistanAlbaniaAlgeriaAndorraAngolaAntigua and BarbudaArab WorldArgentinaArmeniaArubaAustraliaAustriaAzerbaijanBahamas, TheBahrainBangladeshBarbadosBelarusBelgiumBelizeBeninBermudaBhutanBoliviaBosnia and HerzegovinaBotswanaBrazilBrunei DarussalamBulgariaBurkina FasoBurundiCabo VerdeCambodiaCameroonCanadaCaribbean small statesCentral African RepublicCentral Europe and the BalticsChadChileChinaColombiaComorosCongo, Dem. Rep.Congo, Rep.Costa RicaCote d'IvoireCroatiaCubaCuracaoCyprusCzech RepublicDenmarkDjiboutiDominicaDominican RepublicEarly-demographic dividendEast Asia & PacificEast Asia & Pacific (excluding high income)East Asia & Pacific (IDA & IBRD countries)EcuadorEgypt, Arab Rep.El SalvadorEquatorial GuineaEritreaEstoniaEthiopiaEuro areaEurope & Central AsiaEurope & Central Asia (excluding high income)Europe & Central Asia (IDA & IBRD countries)European UnionFijiFinlandFragile and conflict affected situationsFranceGabonGambia, TheGeorgiaGermanyGhanaGreeceGrenadaGuatemalaGuineaGuinea-BissauGuyanaHeavily indebted poor countries (HIPC)High incomeHondurasHong Kong SAR, ChinaHungaryIBRD onlyIcelandIDA & IBRD totalIDA blendIDA onlyIDA totalIndiaIndonesiaIran, Islamic Rep.IraqIrelandIsraelItalyJamaicaJapanJordanKazakhstanKenyaKiribatiKorea, Dem. People’s Rep.Korea, Rep.KuwaitKyrgyz RepublicLao PDRLate-demographic dividendLatin America & Caribbean Latin America & Caribbean (excluding high income)Latin America & the Caribbean (IDA & IBRD countries)LatviaLeast developed countries: UN classificationLebanonLesothoLiberiaLibyaLiechtensteinLithuaniaLow & middle incomeLow incomeLower middle incomeLuxembourgMacao SAR, ChinaMacedonia, FYRMadagascarMalawiMaldivesMaliMaltaMarshall IslandsMauritaniaMauritiusMexicoMicronesia, Fed. Sts.Middle East & North AfricaMiddle East & North Africa (excluding high income)Middle East & North Africa (IDA & IBRD countries)Middle incomeMoldovaMongoliaMontenegroMoroccoMozambiqueMyanmarNamibiaNauruNepalNetherlandsNew ZealandNicaraguaNigerNigeriaNorth AmericaNorwayOECD membersOmanOther small statesPacific island small statesPakistanPalauPanamaPapua New GuineaParaguayPeruPhilippinesPolandPortugalPost-demographic dividendPre-demographic dividendPuerto RicoQatarRomaniaRussian FederationRwandaSamoaSan MarinoSao Tome and PrincipeSaudi ArabiaSenegalSerbiaSeychellesSierra LeoneSlovak RepublicSloveniaSmall statesSolomon IslandsSomaliaSouth AfricaSouth AsiaSouth Asia (IDA & IBRD)SpainSri LankaSt. Kitts and NevisSt. LuciaSt. Vincent and the GrenadinesSub-Saharan Africa Sub-Saharan Africa (excluding high income)Sub-Saharan Africa (IDA & IBRD countries)SudanSurinameSwazilandSwedenSwitzerlandSyrian Arab RepublicTajikistanTanzaniaThailandTimor-LesteTogoTongaTrinidad and TobagoTunisiaTurkeyTurkmenistanTuvaluUgandaUkraineUnited Arab EmiratesUnited KingdomUnited StatesUpper middle incomeUruguayUzbekistanVanuatuVenezuela, RBVietnamWest Bank and GazaWorldYemen, Rep.ZambiaZimbabwe Timeline:
This timeline shows a graph from 1972 to 2015 of Austria. No data until 1971. Number of actual observations by date: 36.
Source name:
World Development Indicators
Source organization:
United Nations Educational, Scientific, and Cultural Organization (UNESCO) Institute for Statistics.
Categories, topics:
Education, Gender
Last updated:
apr 23, 2017
Indicators value changes by year
Minimum:
93.394
jan 1, 1972
Maximum:
110.432
jan 1, 1995
At the date of observation
Value
Absolute change
Change from previous value
jan 1, 1972
93.394
+93.394
0.0%
jan 1, 1977
96.073
+2.678
2.87%
jan 1, 1982
97.379
+1.306
1.36%
jan 1, 1983
95.413
-1.965
-2.02%
jan 1, 1984
96.705
+1.291
1.35%
jan 1, 1985
96.556
-0.149
-0.15%
jan 1, 1986
97.36
+0.804
0.83%
jan 1, 1987
101.614
+4.255
4.37%
jan 1, 1988
102.954
+1.339
1.32%
jan 1, 1989
103.326
+0.373
0.36%
jan 1, 1990
103.113
-0.213
-0.21%
jan 1, 1991
105.797
+2.685
2.6%
jan 1, 1992
107.06
+1.263
1.19%
jan 1, 1993
109.098
+2.038
1.9%
jan 1, 1994
110.251
+1.153
1.06%
jan 1, 1995
110.432
+0.181
0.16%
jan 1, 1996
110.047
-0.385
-0.35%
jan 1, 1997
108.742
-1.305
-1.19%
jan 1, 1998
107.746
-0.997
-0.92%
jan 1, 1999
100.55
-7.196
-6.68%
jan 1, 2000
100.827
+0.277
0.28%
jan 1, 2001
100.853
+0.026
0.03%
jan 1, 2002
101.131
+0.278
0.28%
jan 1, 2003
101.583
+0.452
0.45%
jan 1, 2004
102.208
+0.625
0.62%
jan 1, 2005
102.44
+0.232
0.23%
jan 1, 2006
102.946
+0.506
0.49%
jan 1, 2007
102.473
-0.473
-0.46%
jan 1, 2008
101.787
-0.686
-0.67%
jan 1, 2009
101.6
-0.187
-0.18%
jan 1, 2010
101.961
+0.36
0.35%
jan 1, 2011
100.827
-1.134
-1.11%
jan 1, 2012
100.101
-0.726
-0.72%
jan 1, 2013
99.72
-0.382
-0.38%
jan 1, 2014
100.882
+1.162
1.17%
jan 1, 2015
101.57
+0.688
0.68%
Ranking of countries by current statistics by years


Comments: