29
/
en
AIzaSyAYiBZKx7MnpbEhh9jyipgxe19OcubqV5w
April 1, 2024
27698
East Asia & Pacific
EAS
false
2
1
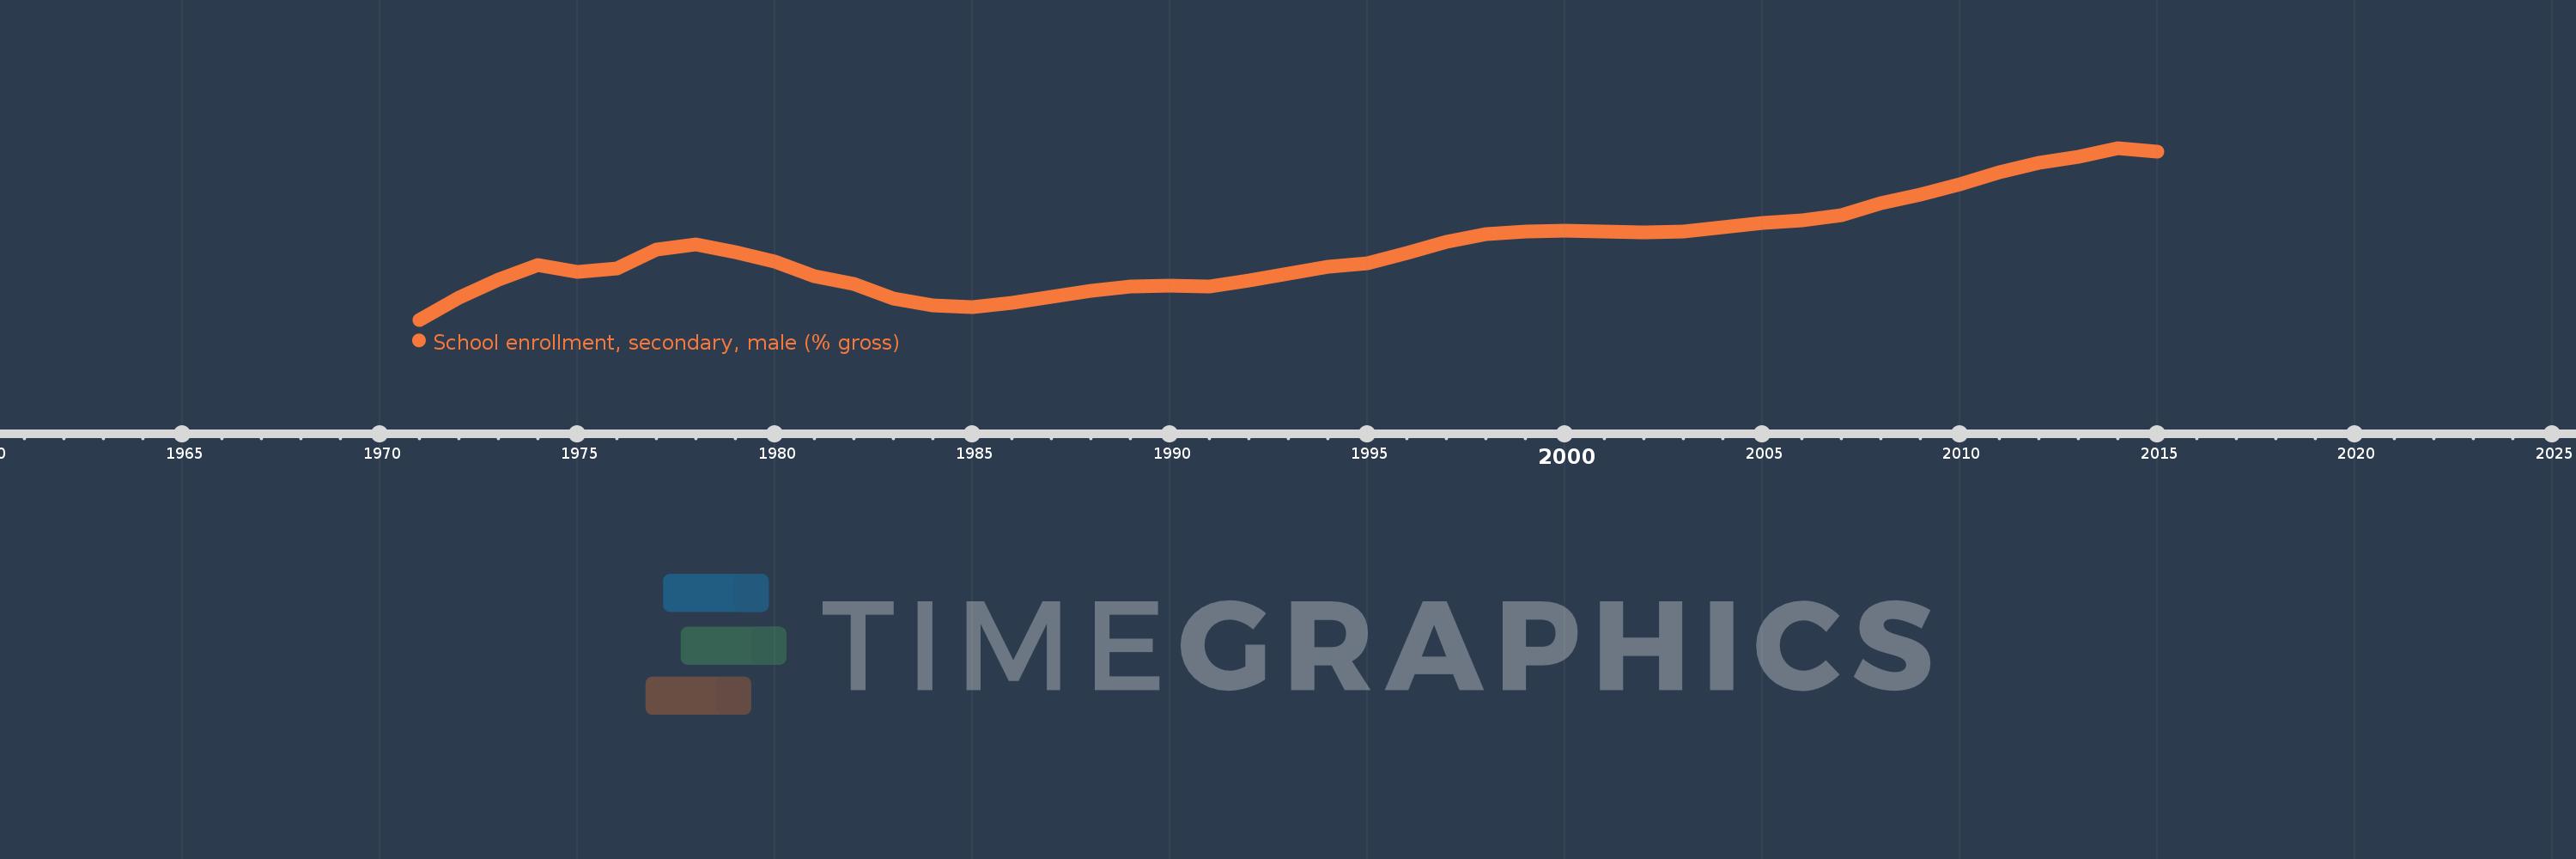
School enrollment, secondary, male (% gross)
2015,2014,2013,2012,2011,2010,2009,2008,2007,2006,2005,2004,2003,2002,2001,2000,1999,1998,1997,1996,1995,1994,1993,1992,1991,1990,1989,1988,1987,1986,1985,1984,1983,1982,1981,1980,1979,1978,1977,1976,1975,1974,1973,1972,1971
This statistics in other country:
AfghanistanAlbaniaAlgeriaAndorraAngolaAntigua and BarbudaArab WorldArgentinaArmeniaArubaAustraliaAustriaAzerbaijanBahamas, TheBahrainBangladeshBarbadosBelarusBelgiumBelizeBeninBermudaBhutanBoliviaBosnia and HerzegovinaBotswanaBrazilBrunei DarussalamBulgariaBurkina FasoBurundiCabo VerdeCambodiaCameroonCanadaCaribbean small statesCentral African RepublicCentral Europe and the BalticsChadChileChinaColombiaComorosCongo, Dem. Rep.Congo, Rep.Costa RicaCote d'IvoireCroatiaCubaCuracaoCyprusCzech RepublicDenmarkDjiboutiDominicaDominican RepublicEarly-demographic dividendEast Asia & PacificEast Asia & Pacific (excluding high income)East Asia & Pacific (IDA & IBRD countries)EcuadorEgypt, Arab Rep.El SalvadorEquatorial GuineaEritreaEstoniaEthiopiaEuro areaEurope & Central AsiaEurope & Central Asia (excluding high income)Europe & Central Asia (IDA & IBRD countries)European UnionFijiFinlandFragile and conflict affected situationsFranceGabonGambia, TheGeorgiaGermanyGhanaGreeceGrenadaGuatemalaGuineaGuinea-BissauGuyanaHeavily indebted poor countries (HIPC)High incomeHondurasHong Kong SAR, ChinaHungaryIBRD onlyIcelandIDA & IBRD totalIDA blendIDA onlyIDA totalIndiaIndonesiaIran, Islamic Rep.IraqIrelandIsraelItalyJamaicaJapanJordanKazakhstanKenyaKiribatiKorea, Dem. People’s Rep.Korea, Rep.KuwaitKyrgyz RepublicLao PDRLate-demographic dividendLatin America & Caribbean Latin America & Caribbean (excluding high income)Latin America & the Caribbean (IDA & IBRD countries)LatviaLeast developed countries: UN classificationLebanonLesothoLiberiaLibyaLiechtensteinLithuaniaLow & middle incomeLow incomeLower middle incomeLuxembourgMacao SAR, ChinaMacedonia, FYRMadagascarMalawiMaldivesMaliMaltaMarshall IslandsMauritaniaMauritiusMexicoMicronesia, Fed. Sts.Middle East & North AfricaMiddle East & North Africa (excluding high income)Middle East & North Africa (IDA & IBRD countries)Middle incomeMoldovaMongoliaMontenegroMoroccoMozambiqueMyanmarNamibiaNauruNepalNetherlandsNew ZealandNicaraguaNigerNigeriaNorth AmericaNorwayOECD membersOmanOther small statesPacific island small statesPakistanPalauPanamaPapua New GuineaParaguayPeruPhilippinesPolandPortugalPost-demographic dividendPre-demographic dividendPuerto RicoQatarRomaniaRussian FederationRwandaSamoaSan MarinoSao Tome and PrincipeSaudi ArabiaSenegalSerbiaSeychellesSierra LeoneSlovak RepublicSloveniaSmall statesSolomon IslandsSomaliaSouth AfricaSouth AsiaSouth Asia (IDA & IBRD)SpainSri LankaSt. Kitts and NevisSt. LuciaSt. Vincent and the GrenadinesSub-Saharan Africa Sub-Saharan Africa (excluding high income)Sub-Saharan Africa (IDA & IBRD countries)SudanSurinameSwazilandSwedenSwitzerlandSyrian Arab RepublicTajikistanTanzaniaThailandTimor-LesteTogoTongaTrinidad and TobagoTunisiaTurkeyTurkmenistanTuvaluUgandaUkraineUnited Arab EmiratesUnited KingdomUnited StatesUpper middle incomeUruguayUzbekistanVanuatuVenezuela, RBVietnamWest Bank and GazaWorldYemen, Rep.ZambiaZimbabwe Timeline:
This timeline shows a graph from 1971 to 2015 of East Asia & Pacific. No data until 1970. Number of actual observations by date: 45.
Source name:
World Development Indicators
Source organization:
United Nations Educational, Scientific, and Cultural Organization (UNESCO) Institute for Statistics.
Categories, topics:
Education, Gender
Last updated:
apr 23, 2017
Indicators value changes by year
Minimum:
38.696
jan 1, 1971
Maximum:
88.777
jan 1, 2014
At the date of observation
Value
Absolute change
Change from previous value
jan 1, 1971
38.696
+38.696
0.0%
jan 1, 1972
45.114
+6.418
16.59%
jan 1, 1973
50.363
+5.249
11.63%
jan 1, 1974
54.635
+4.272
8.48%
jan 1, 1975
52.738
-1.897
-3.47%
jan 1, 1976
53.63
+0.891
1.69%
jan 1, 1977
59.226
+5.596
10.43%
jan 1, 1978
60.653
+1.428
2.41%
jan 1, 1979
58.381
-2.272
-3.75%
jan 1, 1980
55.74
-2.641
-4.52%
jan 1, 1981
51.375
-4.365
-7.83%
jan 1, 1982
49.029
-2.346
-4.57%
jan 1, 1983
44.8
-4.229
-8.63%
jan 1, 1984
42.76
-2.04
-4.55%
jan 1, 1985
42.316
-0.444
-1.04%
jan 1, 1986
43.586
+1.27
3.0%
jan 1, 1987
45.342
+1.756
4.03%
jan 1, 1988
47.185
+1.844
4.07%
jan 1, 1989
48.446
+1.26
2.67%
jan 1, 1990
48.527
+0.081
0.17%
jan 1, 1991
48.326
-0.201
-0.41%
jan 1, 1992
50.018
+1.692
3.5%
jan 1, 1993
52.125
+2.108
4.21%
jan 1, 1994
54.236
+2.111
4.05%
jan 1, 1995
55.272
+1.036
1.91%
jan 1, 1996
58.225
+2.954
5.34%
jan 1, 1997
61.477
+3.251
5.58%
jan 1, 1998
63.73
+2.254
3.67%
jan 1, 1999
64.381
+0.651
1.02%
jan 1, 2000
64.71
+0.329
0.51%
jan 1, 2001
64.46
-0.25
-0.39%
jan 1, 2002
64.163
-0.297
-0.46%
jan 1, 2003
64.329
+0.166
0.26%
jan 1, 2004
65.663
+1.334
2.07%
jan 1, 2005
66.805
+1.142
1.74%
jan 1, 2006
67.576
+0.771
1.15%
jan 1, 2007
69.192
+1.616
2.39%
jan 1, 2008
72.798
+3.606
5.21%
jan 1, 2009
75.246
+2.448
3.36%
jan 1, 2010
78.134
+2.888
3.84%
jan 1, 2011
81.653
+3.519
4.5%
jan 1, 2012
84.387
+2.734
3.35%
jan 1, 2013
86.158
+1.771
2.1%
jan 1, 2014
88.777
+2.62
3.04%
jan 1, 2015
87.582
-1.195
-1.35%
Ranking of countries by current statistics by years


Comments: