29
/
en
AIzaSyAYiBZKx7MnpbEhh9jyipgxe19OcubqV5w
April 1, 2024
160980
Israel
ISR
true
2
1
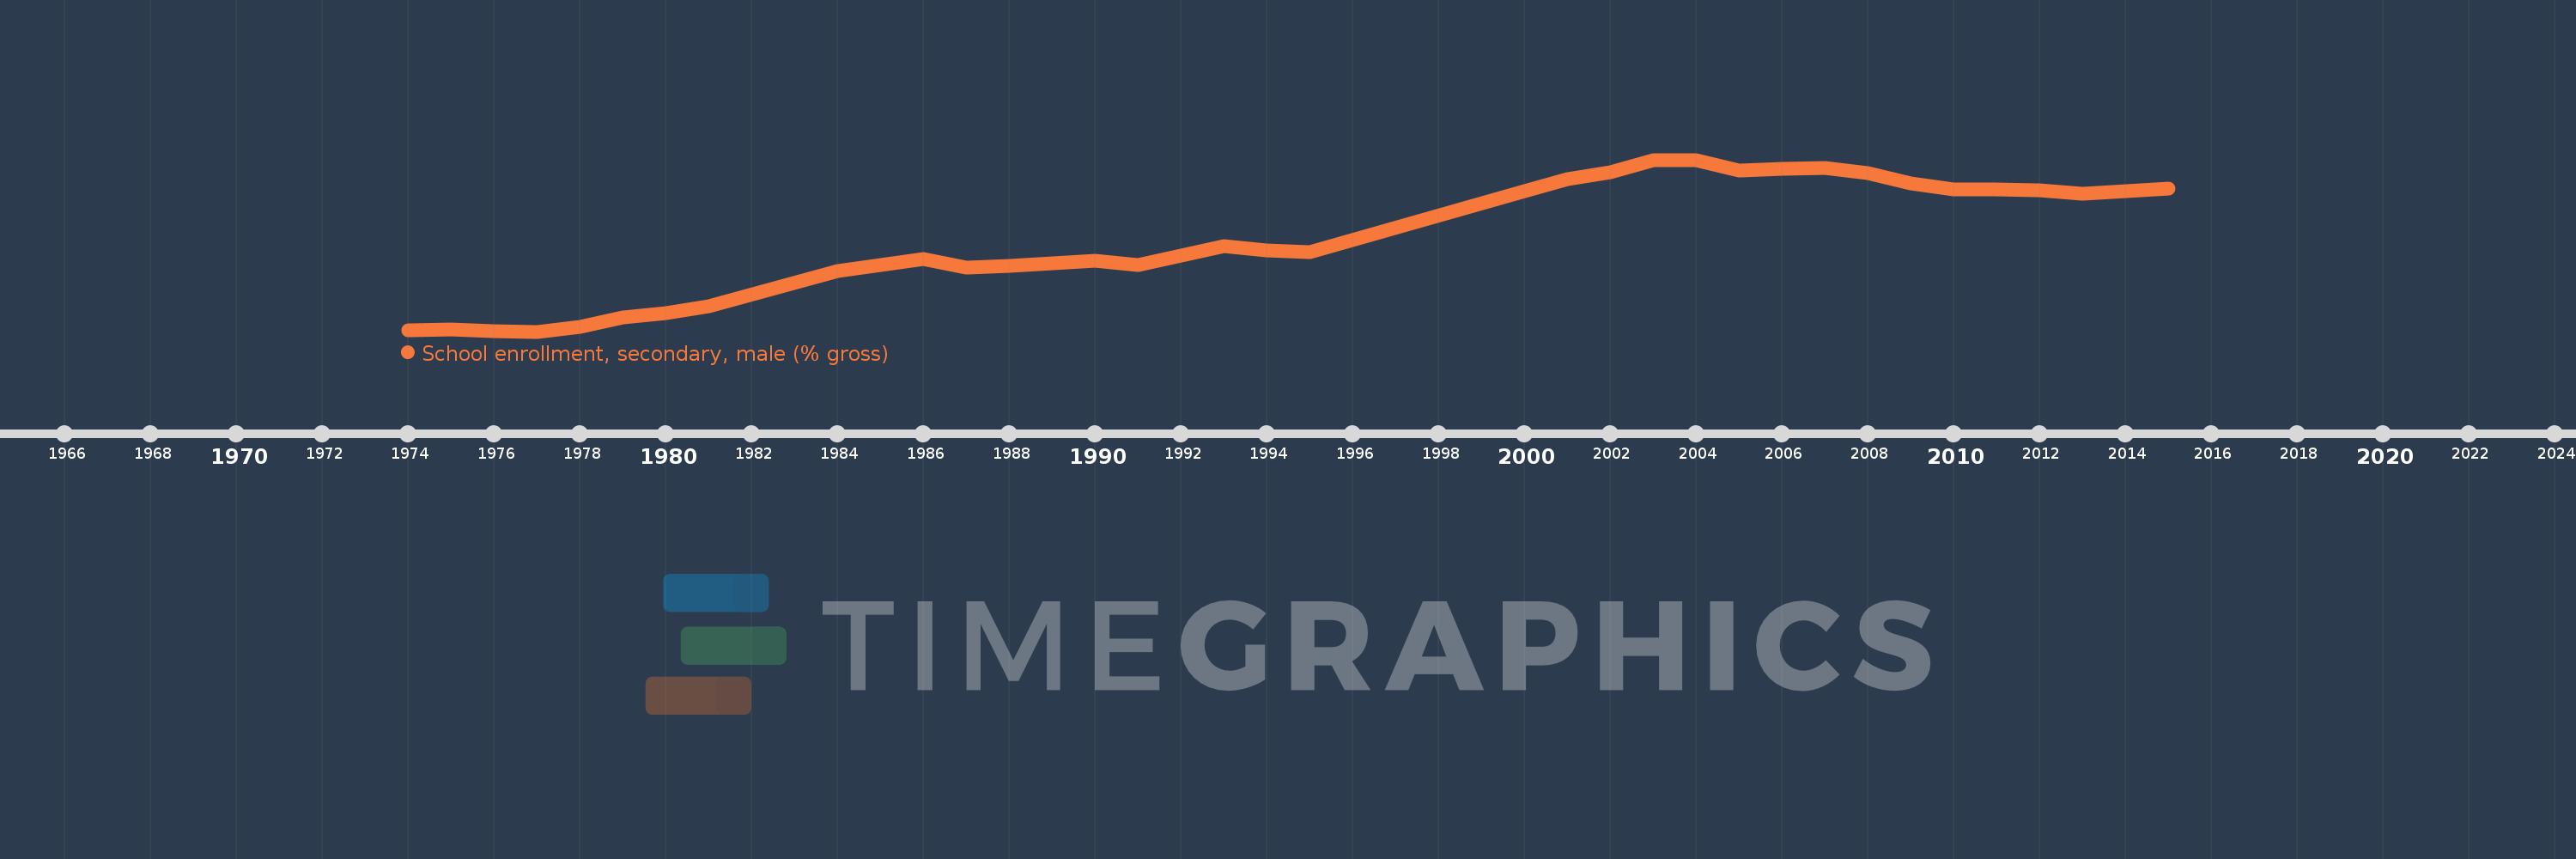
School enrollment, secondary, male (% gross)
2015,2014,2013,2012,2011,2010,2009,2008,2007,2006,2005,2004,2003,2002,2001,2000,1995,1994,1993,1992,1991,1990,1989,1988,1987,1986,1985,1984,1981,1980,1979,1978,1977,1976,1975,1974
This statistics in other country:
AfghanistanAlbaniaAlgeriaAndorraAngolaAntigua and BarbudaArab WorldArgentinaArmeniaArubaAustraliaAustriaAzerbaijanBahamas, TheBahrainBangladeshBarbadosBelarusBelgiumBelizeBeninBermudaBhutanBoliviaBosnia and HerzegovinaBotswanaBrazilBrunei DarussalamBulgariaBurkina FasoBurundiCabo VerdeCambodiaCameroonCanadaCaribbean small statesCentral African RepublicCentral Europe and the BalticsChadChileChinaColombiaComorosCongo, Dem. Rep.Congo, Rep.Costa RicaCote d'IvoireCroatiaCubaCuracaoCyprusCzech RepublicDenmarkDjiboutiDominicaDominican RepublicEarly-demographic dividendEast Asia & PacificEast Asia & Pacific (excluding high income)East Asia & Pacific (IDA & IBRD countries)EcuadorEgypt, Arab Rep.El SalvadorEquatorial GuineaEritreaEstoniaEthiopiaEuro areaEurope & Central AsiaEurope & Central Asia (excluding high income)Europe & Central Asia (IDA & IBRD countries)European UnionFijiFinlandFragile and conflict affected situationsFranceGabonGambia, TheGeorgiaGermanyGhanaGreeceGrenadaGuatemalaGuineaGuinea-BissauGuyanaHeavily indebted poor countries (HIPC)High incomeHondurasHong Kong SAR, ChinaHungaryIBRD onlyIcelandIDA & IBRD totalIDA blendIDA onlyIDA totalIndiaIndonesiaIran, Islamic Rep.IraqIrelandIsraelItalyJamaicaJapanJordanKazakhstanKenyaKiribatiKorea, Dem. People’s Rep.Korea, Rep.KuwaitKyrgyz RepublicLao PDRLate-demographic dividendLatin America & Caribbean Latin America & Caribbean (excluding high income)Latin America & the Caribbean (IDA & IBRD countries)LatviaLeast developed countries: UN classificationLebanonLesothoLiberiaLibyaLiechtensteinLithuaniaLow & middle incomeLow incomeLower middle incomeLuxembourgMacao SAR, ChinaMacedonia, FYRMadagascarMalawiMaldivesMaliMaltaMarshall IslandsMauritaniaMauritiusMexicoMicronesia, Fed. Sts.Middle East & North AfricaMiddle East & North Africa (excluding high income)Middle East & North Africa (IDA & IBRD countries)Middle incomeMoldovaMongoliaMontenegroMoroccoMozambiqueMyanmarNamibiaNauruNepalNetherlandsNew ZealandNicaraguaNigerNigeriaNorth AmericaNorwayOECD membersOmanOther small statesPacific island small statesPakistanPalauPanamaPapua New GuineaParaguayPeruPhilippinesPolandPortugalPost-demographic dividendPre-demographic dividendPuerto RicoQatarRomaniaRussian FederationRwandaSamoaSan MarinoSao Tome and PrincipeSaudi ArabiaSenegalSerbiaSeychellesSierra LeoneSlovak RepublicSloveniaSmall statesSolomon IslandsSomaliaSouth AfricaSouth AsiaSouth Asia (IDA & IBRD)SpainSri LankaSt. Kitts and NevisSt. LuciaSt. Vincent and the GrenadinesSub-Saharan Africa Sub-Saharan Africa (excluding high income)Sub-Saharan Africa (IDA & IBRD countries)SudanSurinameSwazilandSwedenSwitzerlandSyrian Arab RepublicTajikistanTanzaniaThailandTimor-LesteTogoTongaTrinidad and TobagoTunisiaTurkeyTurkmenistanTuvaluUgandaUkraineUnited Arab EmiratesUnited KingdomUnited StatesUpper middle incomeUruguayUzbekistanVanuatuVenezuela, RBVietnamWest Bank and GazaWorldYemen, Rep.ZambiaZimbabwe Timeline:
This timeline shows a graph from 1974 to 2015 of Israel. No data until 1973. Number of actual observations by date: 36.
Source name:
World Development Indicators
Source organization:
United Nations Educational, Scientific, and Cultural Organization (UNESCO) Institute for Statistics.
Categories, topics:
Education, Gender
Last updated:
apr 23, 2017
Indicators value changes by year
Minimum:
73.084
jan 1, 1977
Maximum:
106.751
jan 1, 2003
At the date of observation
Value
Absolute change
Change from previous value
jan 1, 1974
73.392
+73.392
0.0%
jan 1, 1975
73.534
+0.142
0.19%
jan 1, 1976
73.13
-0.404
-0.55%
jan 1, 1977
73.084
-0.046
-0.06%
jan 1, 1978
74.08
+0.995
1.36%
jan 1, 1979
75.795
+1.716
2.32%
jan 1, 1980
76.651
+0.856
1.13%
jan 1, 1981
78.06
+1.409
1.84%
jan 1, 1984
84.897
+6.837
8.76%
jan 1, 1985
86.102
+1.204
1.42%
jan 1, 1986
87.308
+1.207
1.4%
jan 1, 1987
85.606
-1.702
-1.95%
jan 1, 1988
86.037
+0.431
0.5%
jan 1, 1989
86.542
+0.505
0.59%
jan 1, 1990
86.888
+0.346
0.4%
jan 1, 1991
86.113
-0.775
-0.89%
jan 1, 1992
88.032
+1.919
2.23%
jan 1, 1993
89.883
+1.85
2.1%
jan 1, 1994
88.989
-0.894
-0.99%
jan 1, 1995
88.611
-0.378
-0.43%
jan 1, 2000
100.66
+12.049
13.6%
jan 1, 2001
102.968
+2.308
2.29%
jan 1, 2002
104.262
+1.293
1.26%
jan 1, 2003
106.751
+2.489
2.39%
jan 1, 2004
106.586
-0.165
-0.15%
jan 1, 2005
104.696
-1.889
-1.77%
jan 1, 2006
105.039
+0.343
0.33%
jan 1, 2007
105.097
+0.058
0.06%
jan 1, 2008
104.097
-1.001
-0.95%
jan 1, 2009
102.05
-2.047
-1.97%
jan 1, 2010
100.933
-1.116
-1.09%
jan 1, 2011
100.87
-0.063
-0.06%
jan 1, 2012
100.702
-0.169
-0.17%
jan 1, 2013
100.07
-0.631
-0.63%
jan 1, 2014
100.563
+0.493
0.49%
jan 1, 2015
101.105
+0.542
0.54%
Ranking of countries by current statistics by years


Comments: