29
/
en
AIzaSyAYiBZKx7MnpbEhh9jyipgxe19OcubqV5w
April 1, 2024
207420
Nepal
NPL
true
2
1
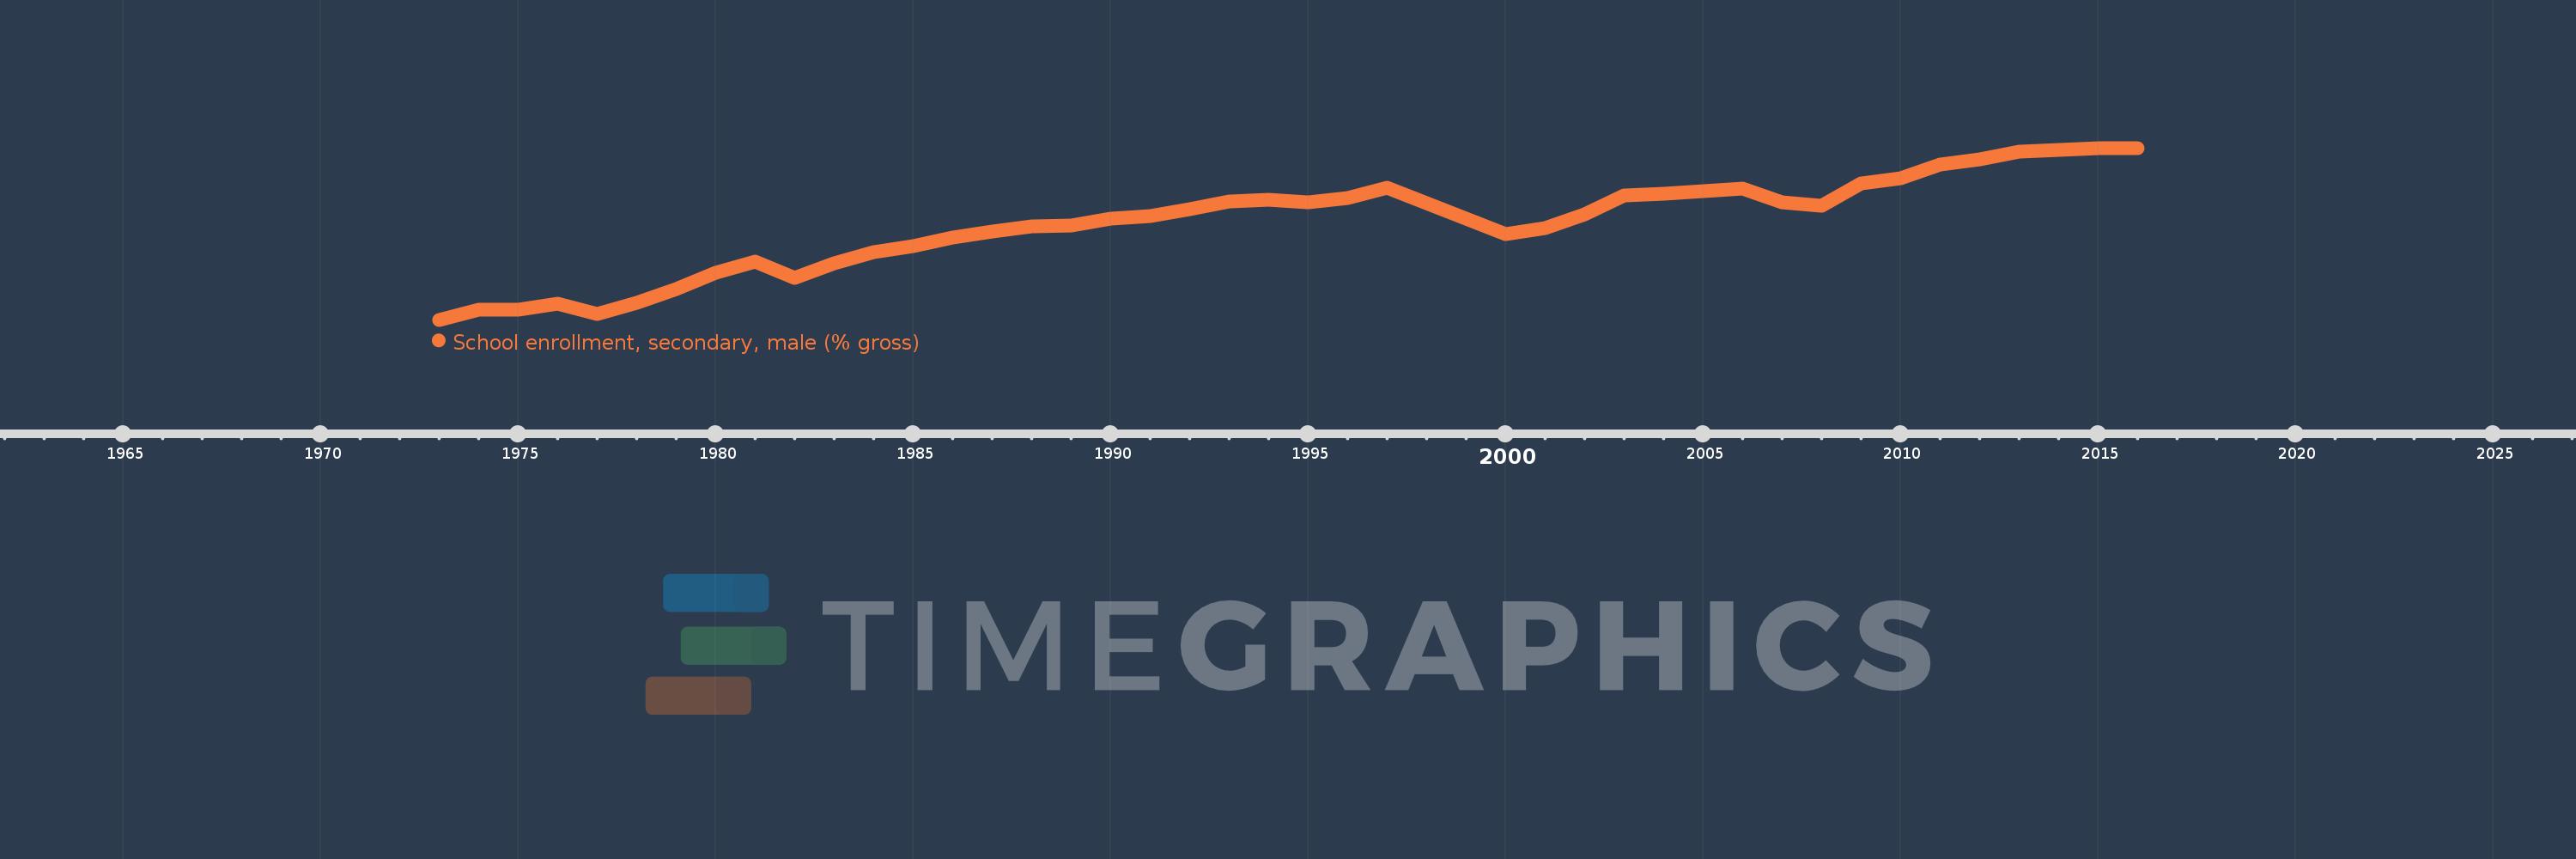
School enrollment, secondary, male (% gross)
2016,2015,2014,2013,2012,2011,2010,2009,2008,2007,2006,2004,2003,2002,2001,2000,1997,1996,1995,1994,1993,1992,1991,1990,1989,1988,1987,1986,1985,1984,1983,1982,1981,1980,1979,1978,1977,1976,1975,1974,1973
This statistics in other country:
AfghanistanAlbaniaAlgeriaAndorraAngolaAntigua and BarbudaArab WorldArgentinaArmeniaArubaAustraliaAustriaAzerbaijanBahamas, TheBahrainBangladeshBarbadosBelarusBelgiumBelizeBeninBermudaBhutanBoliviaBosnia and HerzegovinaBotswanaBrazilBrunei DarussalamBulgariaBurkina FasoBurundiCabo VerdeCambodiaCameroonCanadaCaribbean small statesCentral African RepublicCentral Europe and the BalticsChadChileChinaColombiaComorosCongo, Dem. Rep.Congo, Rep.Costa RicaCote d'IvoireCroatiaCubaCuracaoCyprusCzech RepublicDenmarkDjiboutiDominicaDominican RepublicEarly-demographic dividendEast Asia & PacificEast Asia & Pacific (excluding high income)East Asia & Pacific (IDA & IBRD countries)EcuadorEgypt, Arab Rep.El SalvadorEquatorial GuineaEritreaEstoniaEthiopiaEuro areaEurope & Central AsiaEurope & Central Asia (excluding high income)Europe & Central Asia (IDA & IBRD countries)European UnionFijiFinlandFragile and conflict affected situationsFranceGabonGambia, TheGeorgiaGermanyGhanaGreeceGrenadaGuatemalaGuineaGuinea-BissauGuyanaHeavily indebted poor countries (HIPC)High incomeHondurasHong Kong SAR, ChinaHungaryIBRD onlyIcelandIDA & IBRD totalIDA blendIDA onlyIDA totalIndiaIndonesiaIran, Islamic Rep.IraqIrelandIsraelItalyJamaicaJapanJordanKazakhstanKenyaKiribatiKorea, Dem. People’s Rep.Korea, Rep.KuwaitKyrgyz RepublicLao PDRLate-demographic dividendLatin America & Caribbean Latin America & Caribbean (excluding high income)Latin America & the Caribbean (IDA & IBRD countries)LatviaLeast developed countries: UN classificationLebanonLesothoLiberiaLibyaLiechtensteinLithuaniaLow & middle incomeLow incomeLower middle incomeLuxembourgMacao SAR, ChinaMacedonia, FYRMadagascarMalawiMaldivesMaliMaltaMarshall IslandsMauritaniaMauritiusMexicoMicronesia, Fed. Sts.Middle East & North AfricaMiddle East & North Africa (excluding high income)Middle East & North Africa (IDA & IBRD countries)Middle incomeMoldovaMongoliaMontenegroMoroccoMozambiqueMyanmarNamibiaNauruNepalNetherlandsNew ZealandNicaraguaNigerNigeriaNorth AmericaNorwayOECD membersOmanOther small statesPacific island small statesPakistanPalauPanamaPapua New GuineaParaguayPeruPhilippinesPolandPortugalPost-demographic dividendPre-demographic dividendPuerto RicoQatarRomaniaRussian FederationRwandaSamoaSan MarinoSao Tome and PrincipeSaudi ArabiaSenegalSerbiaSeychellesSierra LeoneSlovak RepublicSloveniaSmall statesSolomon IslandsSomaliaSouth AfricaSouth AsiaSouth Asia (IDA & IBRD)SpainSri LankaSt. Kitts and NevisSt. LuciaSt. Vincent and the GrenadinesSub-Saharan Africa Sub-Saharan Africa (excluding high income)Sub-Saharan Africa (IDA & IBRD countries)SudanSurinameSwazilandSwedenSwitzerlandSyrian Arab RepublicTajikistanTanzaniaThailandTimor-LesteTogoTongaTrinidad and TobagoTunisiaTurkeyTurkmenistanTuvaluUgandaUkraineUnited Arab EmiratesUnited KingdomUnited StatesUpper middle incomeUruguayUzbekistanVanuatuVenezuela, RBVietnamWest Bank and GazaWorldYemen, Rep.ZambiaZimbabwe Timeline:
This timeline shows a graph from 1973 to 2016 of Nepal. No data until 1972. Number of actual observations by date: 41.
Source name:
World Development Indicators
Source organization:
United Nations Educational, Scientific, and Cultural Organization (UNESCO) Institute for Statistics.
Categories, topics:
Education, Gender
Last updated:
apr 23, 2017
Indicators value changes by year
Minimum:
18.059
jan 1, 1973
Maximum:
64.922
jan 1, 2015
At the date of observation
Value
Absolute change
Change from previous value
jan 1, 1973
18.059
+18.059
0.0%
jan 1, 1974
20.709
+2.65
14.67%
jan 1, 1975
20.893
+0.184
0.89%
jan 1, 1976
22.331
+1.438
6.88%
jan 1, 1977
19.671
-2.66
-11.91%
jan 1, 1978
22.564
+2.893
14.71%
jan 1, 1979
26.494
+3.93
17.42%
jan 1, 1980
30.86
+4.366
16.48%
jan 1, 1981
34.028
+3.169
10.27%
jan 1, 1982
29.412
-4.616
-13.57%
jan 1, 1983
33.53
+4.119
14.0%
jan 1, 1984
36.384
+2.854
8.51%
jan 1, 1985
38.033
+1.649
4.53%
jan 1, 1986
40.496
+2.462
6.47%
jan 1, 1987
42.034
+1.538
3.8%
jan 1, 1988
43.46
+1.427
3.39%
jan 1, 1989
43.876
+0.416
0.96%
jan 1, 1990
45.593
+1.716
3.91%
jan 1, 1991
46.35
+0.757
1.66%
jan 1, 1992
48.111
+1.762
3.8%
jan 1, 1993
50.216
+2.105
4.37%
jan 1, 1994
50.897
+0.681
1.36%
jan 1, 1995
50.175
-0.722
-1.42%
jan 1, 1996
51.377
+1.203
2.4%
jan 1, 1997
54.134
+2.757
5.37%
jan 1, 2000
41.34
-12.794
-23.63%
jan 1, 2001
42.951
+1.61
3.9%
jan 1, 2002
46.722
+3.772
8.78%
jan 1, 2003
51.904
+5.181
11.09%
jan 1, 2004
52.519
+0.615
1.19%
jan 1, 2006
53.905
+1.386
2.64%
jan 1, 2007
49.998
-3.907
-7.25%
jan 1, 2008
49.07
-0.928
-1.86%
jan 1, 2009
55.239
+6.169
12.57%
jan 1, 2010
56.672
+1.433
2.59%
jan 1, 2011
60.311
+3.64
6.42%
jan 1, 2012
61.691
+1.38
2.29%
jan 1, 2013
63.842
+2.151
3.49%
jan 1, 2014
64.49
+0.648
1.01%
jan 1, 2015
64.922
+0.432
0.67%
jan 1, 2016
64.861
-0.061
-0.09%
Ranking of countries by current statistics by years


Comments: