29
/
en
AIzaSyAYiBZKx7MnpbEhh9jyipgxe19OcubqV5w
April 1, 2024
238724
Seychelles
SYC
true
2
1
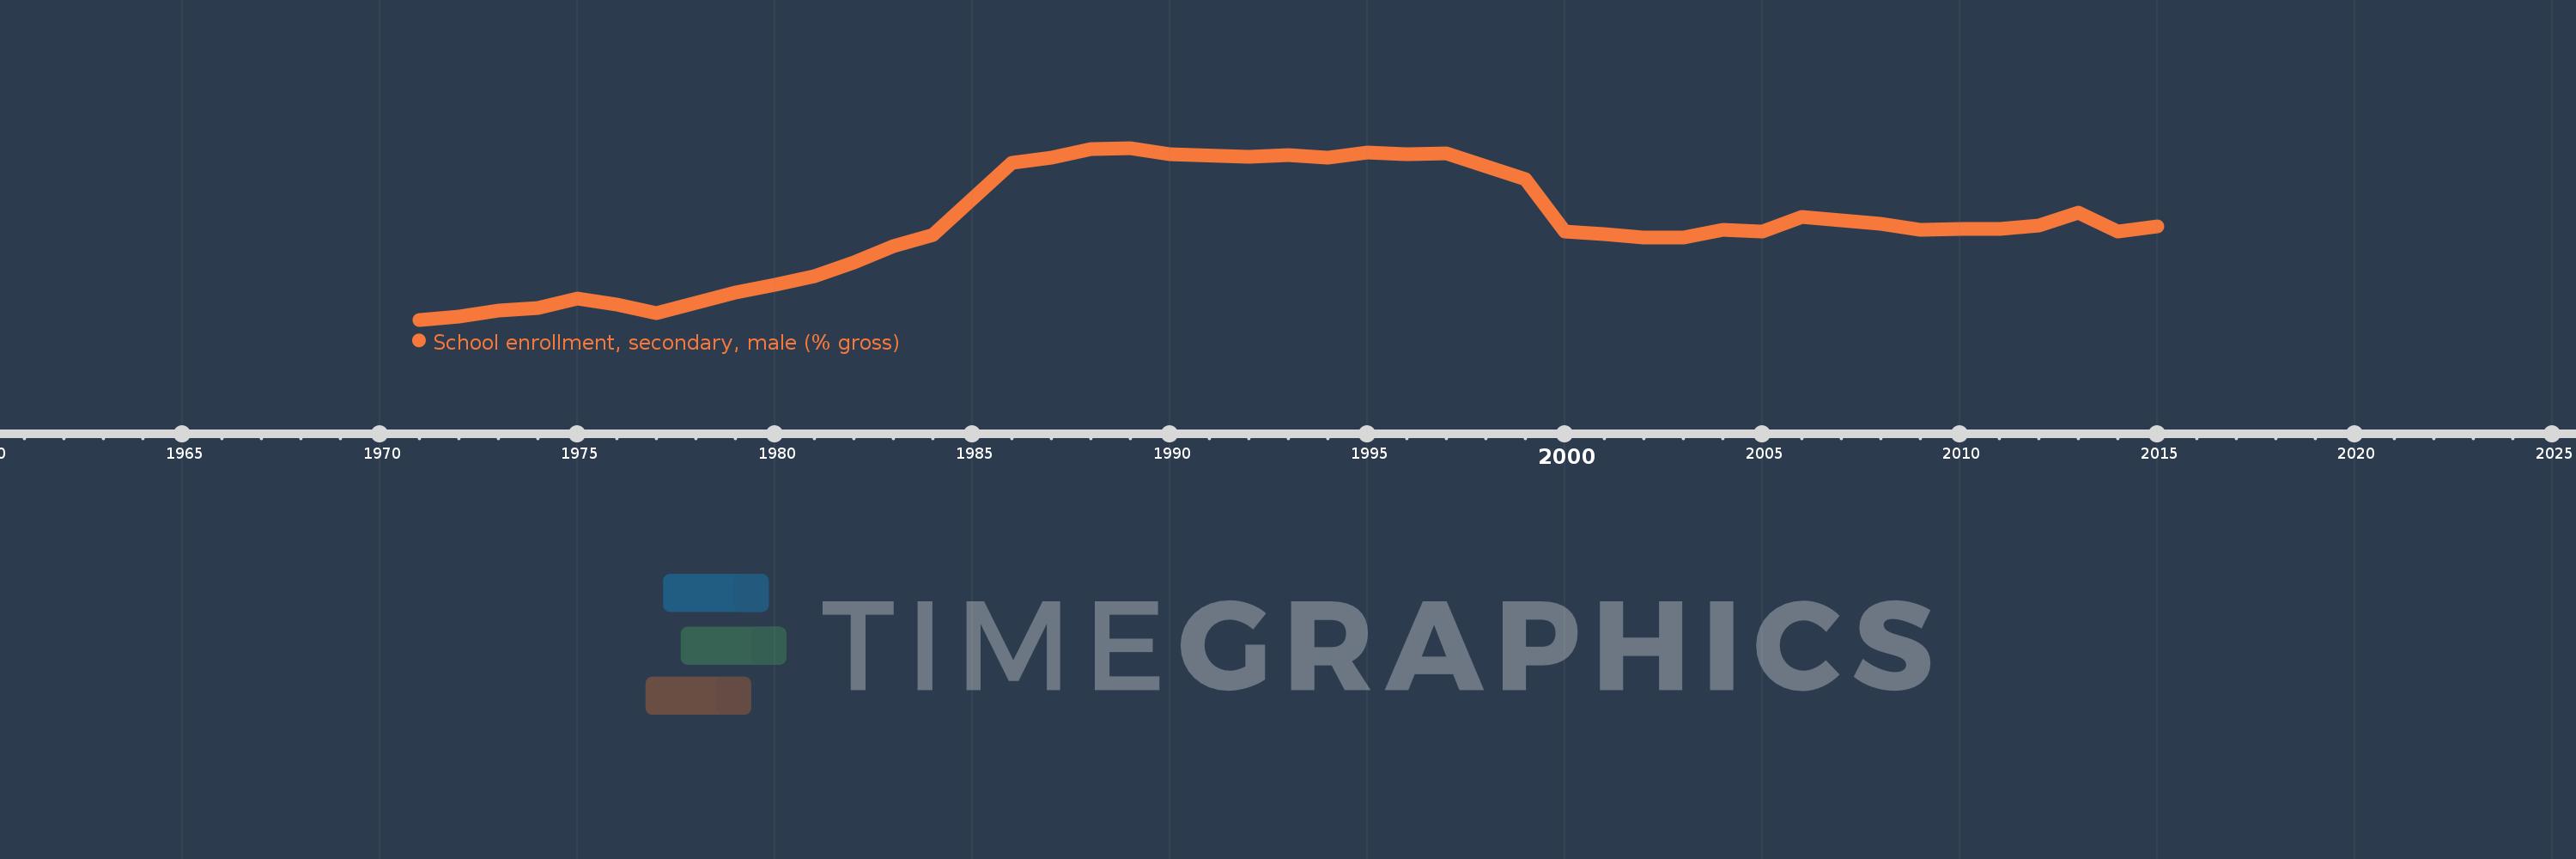
School enrollment, secondary, male (% gross)
2015,2014,2013,2012,2011,2010,2009,2008,2006,2005,2004,2003,2002,2001,2000,1999,1997,1996,1995,1994,1993,1992,1990,1989,1988,1987,1986,1984,1983,1982,1981,1980,1979,1977,1976,1975,1974,1973,1972,1971
This statistics in other country:
AfghanistanAlbaniaAlgeriaAndorraAngolaAntigua and BarbudaArab WorldArgentinaArmeniaArubaAustraliaAustriaAzerbaijanBahamas, TheBahrainBangladeshBarbadosBelarusBelgiumBelizeBeninBermudaBhutanBoliviaBosnia and HerzegovinaBotswanaBrazilBrunei DarussalamBulgariaBurkina FasoBurundiCabo VerdeCambodiaCameroonCanadaCaribbean small statesCentral African RepublicCentral Europe and the BalticsChadChileChinaColombiaComorosCongo, Dem. Rep.Congo, Rep.Costa RicaCote d'IvoireCroatiaCubaCuracaoCyprusCzech RepublicDenmarkDjiboutiDominicaDominican RepublicEarly-demographic dividendEast Asia & PacificEast Asia & Pacific (excluding high income)East Asia & Pacific (IDA & IBRD countries)EcuadorEgypt, Arab Rep.El SalvadorEquatorial GuineaEritreaEstoniaEthiopiaEuro areaEurope & Central AsiaEurope & Central Asia (excluding high income)Europe & Central Asia (IDA & IBRD countries)European UnionFijiFinlandFragile and conflict affected situationsFranceGabonGambia, TheGeorgiaGermanyGhanaGreeceGrenadaGuatemalaGuineaGuinea-BissauGuyanaHeavily indebted poor countries (HIPC)High incomeHondurasHong Kong SAR, ChinaHungaryIBRD onlyIcelandIDA & IBRD totalIDA blendIDA onlyIDA totalIndiaIndonesiaIran, Islamic Rep.IraqIrelandIsraelItalyJamaicaJapanJordanKazakhstanKenyaKiribatiKorea, Dem. People’s Rep.Korea, Rep.KuwaitKyrgyz RepublicLao PDRLate-demographic dividendLatin America & Caribbean Latin America & Caribbean (excluding high income)Latin America & the Caribbean (IDA & IBRD countries)LatviaLeast developed countries: UN classificationLebanonLesothoLiberiaLibyaLiechtensteinLithuaniaLow & middle incomeLow incomeLower middle incomeLuxembourgMacao SAR, ChinaMacedonia, FYRMadagascarMalawiMaldivesMaliMaltaMarshall IslandsMauritaniaMauritiusMexicoMicronesia, Fed. Sts.Middle East & North AfricaMiddle East & North Africa (excluding high income)Middle East & North Africa (IDA & IBRD countries)Middle incomeMoldovaMongoliaMontenegroMoroccoMozambiqueMyanmarNamibiaNauruNepalNetherlandsNew ZealandNicaraguaNigerNigeriaNorth AmericaNorwayOECD membersOmanOther small statesPacific island small statesPakistanPalauPanamaPapua New GuineaParaguayPeruPhilippinesPolandPortugalPost-demographic dividendPre-demographic dividendPuerto RicoQatarRomaniaRussian FederationRwandaSamoaSan MarinoSao Tome and PrincipeSaudi ArabiaSenegalSerbiaSeychellesSierra LeoneSlovak RepublicSloveniaSmall statesSolomon IslandsSomaliaSouth AfricaSouth AsiaSouth Asia (IDA & IBRD)SpainSri LankaSt. Kitts and NevisSt. LuciaSt. Vincent and the GrenadinesSub-Saharan Africa Sub-Saharan Africa (excluding high income)Sub-Saharan Africa (IDA & IBRD countries)SudanSurinameSwazilandSwedenSwitzerlandSyrian Arab RepublicTajikistanTanzaniaThailandTimor-LesteTogoTongaTrinidad and TobagoTunisiaTurkeyTurkmenistanTuvaluUgandaUkraineUnited Arab EmiratesUnited KingdomUnited StatesUpper middle incomeUruguayUzbekistanVanuatuVenezuela, RBVietnamWest Bank and GazaWorldYemen, Rep.ZambiaZimbabwe Timeline:
This timeline shows a graph from 1971 to 2015 of Seychelles. No data until 1970. Number of actual observations by date: 40.
Source name:
World Development Indicators
Source organization:
United Nations Educational, Scientific, and Cultural Organization (UNESCO) Institute for Statistics.
Categories, topics:
Education, Gender
Last updated:
apr 23, 2017
Indicators value changes by year
Minimum:
23.268
jan 1, 1971
Maximum:
116.407
jan 1, 1989
At the date of observation
Value
Absolute change
Change from previous value
jan 1, 1971
23.268
+23.268
0.0%
jan 1, 1972
25.005
+1.738
7.47%
jan 1, 1973
28.214
+3.208
12.83%
jan 1, 1974
29.439
+1.226
4.34%
jan 1, 1975
34.652
+5.213
17.71%
jan 1, 1976
31.438
-3.215
-9.28%
jan 1, 1977
27.067
-4.371
-13.9%
jan 1, 1979
37.825
+10.758
39.75%
jan 1, 1980
41.996
+4.172
11.03%
jan 1, 1981
46.838
+4.842
11.53%
jan 1, 1982
54.237
+7.399
15.8%
jan 1, 1983
63.29
+9.053
16.69%
jan 1, 1984
69.464
+6.175
9.76%
jan 1, 1986
108.581
+39.116
56.31%
jan 1, 1987
111.314
+2.733
2.52%
jan 1, 1988
115.744
+4.431
3.98%
jan 1, 1989
116.407
+0.663
0.57%
jan 1, 1990
113.13
-3.277
-2.82%
jan 1, 1992
111.473
-1.656
-1.46%
jan 1, 1993
112.503
+1.03
0.92%
jan 1, 1994
111.216
-1.287
-1.14%
jan 1, 1995
114.135
+2.919
2.62%
jan 1, 1996
112.971
-1.164
-1.02%
jan 1, 1997
113.462
+0.49
0.43%
jan 1, 1999
99.708
-13.754
-12.12%
jan 1, 2000
71.088
-28.62
-28.7%
jan 1, 2001
69.524
-1.564
-2.2%
jan 1, 2002
67.749
-1.775
-2.55%
jan 1, 2003
68.022
+0.273
0.4%
jan 1, 2004
72.069
+4.047
5.95%
jan 1, 2005
71.261
-0.808
-1.12%
jan 1, 2006
78.987
+7.726
10.84%
jan 1, 2008
75.458
-3.529
-4.47%
jan 1, 2009
72.018
-3.44
-4.56%
jan 1, 2010
72.465
+0.447
0.62%
jan 1, 2011
72.439
-0.025
-0.03%
jan 1, 2012
74.32
+1.881
2.6%
jan 1, 2013
81.27
+6.95
9.35%
jan 1, 2014
71.31
-9.96
-12.26%
jan 1, 2015
73.875
+2.565
3.6%
Ranking of countries by current statistics by years


Comments: