29
/
en
AIzaSyAYiBZKx7MnpbEhh9jyipgxe19OcubqV5w
April 1, 2024
134575
France
FRA
true
2
1
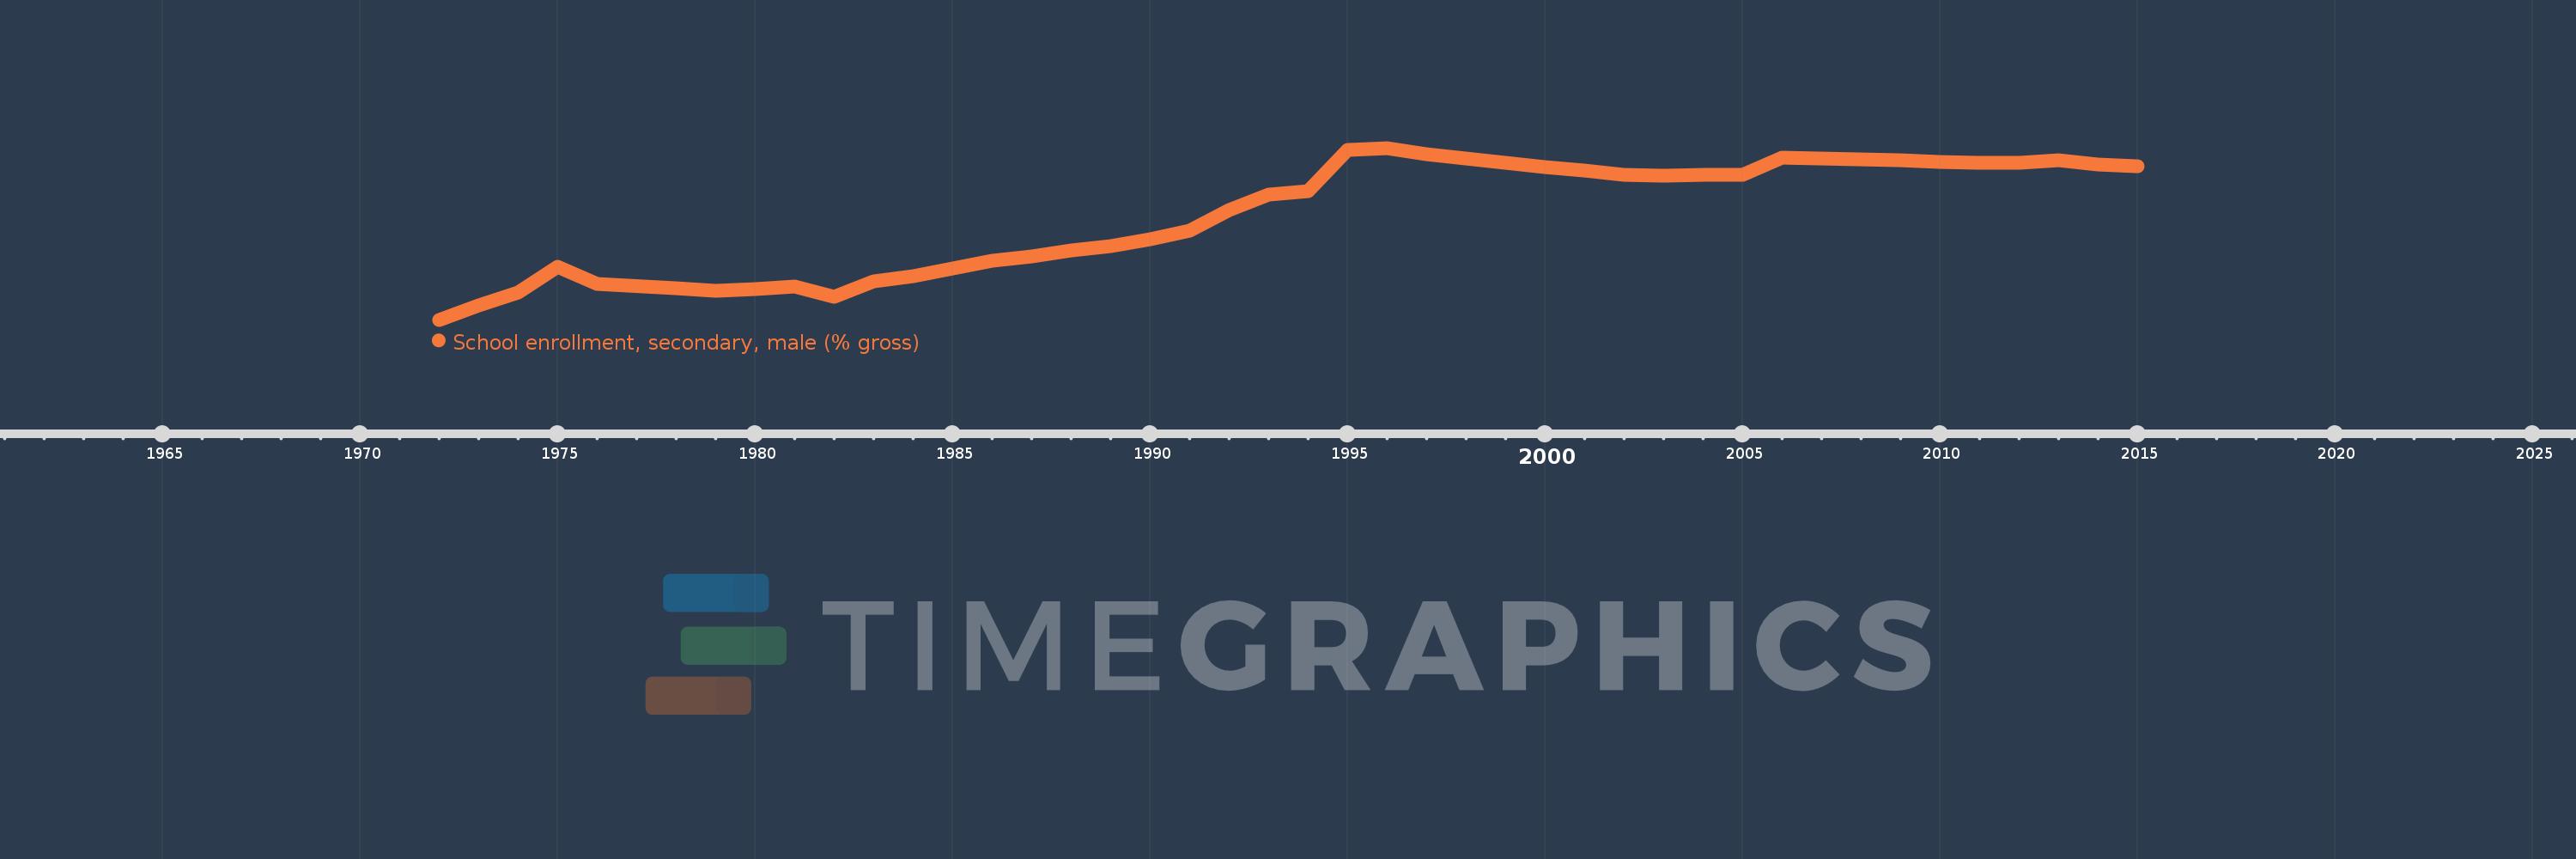
School enrollment, secondary, male (% gross)
2015,2014,2013,2012,2011,2010,2009,2008,2007,2006,2005,2004,2003,2002,2001,2000,1999,1998,1997,1996,1995,1994,1993,1992,1991,1990,1989,1988,1987,1986,1984,1983,1982,1981,1980,1979,1978,1976,1975,1974,1973,1972
This statistics in other country:
AfghanistanAlbaniaAlgeriaAndorraAngolaAntigua and BarbudaArab WorldArgentinaArmeniaArubaAustraliaAustriaAzerbaijanBahamas, TheBahrainBangladeshBarbadosBelarusBelgiumBelizeBeninBermudaBhutanBoliviaBosnia and HerzegovinaBotswanaBrazilBrunei DarussalamBulgariaBurkina FasoBurundiCabo VerdeCambodiaCameroonCanadaCaribbean small statesCentral African RepublicCentral Europe and the BalticsChadChileChinaColombiaComorosCongo, Dem. Rep.Congo, Rep.Costa RicaCote d'IvoireCroatiaCubaCuracaoCyprusCzech RepublicDenmarkDjiboutiDominicaDominican RepublicEarly-demographic dividendEast Asia & PacificEast Asia & Pacific (excluding high income)East Asia & Pacific (IDA & IBRD countries)EcuadorEgypt, Arab Rep.El SalvadorEquatorial GuineaEritreaEstoniaEthiopiaEuro areaEurope & Central AsiaEurope & Central Asia (excluding high income)Europe & Central Asia (IDA & IBRD countries)European UnionFijiFinlandFragile and conflict affected situationsFranceGabonGambia, TheGeorgiaGermanyGhanaGreeceGrenadaGuatemalaGuineaGuinea-BissauGuyanaHeavily indebted poor countries (HIPC)High incomeHondurasHong Kong SAR, ChinaHungaryIBRD onlyIcelandIDA & IBRD totalIDA blendIDA onlyIDA totalIndiaIndonesiaIran, Islamic Rep.IraqIrelandIsraelItalyJamaicaJapanJordanKazakhstanKenyaKiribatiKorea, Dem. People’s Rep.Korea, Rep.KuwaitKyrgyz RepublicLao PDRLate-demographic dividendLatin America & Caribbean Latin America & Caribbean (excluding high income)Latin America & the Caribbean (IDA & IBRD countries)LatviaLeast developed countries: UN classificationLebanonLesothoLiberiaLibyaLiechtensteinLithuaniaLow & middle incomeLow incomeLower middle incomeLuxembourgMacao SAR, ChinaMacedonia, FYRMadagascarMalawiMaldivesMaliMaltaMarshall IslandsMauritaniaMauritiusMexicoMicronesia, Fed. Sts.Middle East & North AfricaMiddle East & North Africa (excluding high income)Middle East & North Africa (IDA & IBRD countries)Middle incomeMoldovaMongoliaMontenegroMoroccoMozambiqueMyanmarNamibiaNauruNepalNetherlandsNew ZealandNicaraguaNigerNigeriaNorth AmericaNorwayOECD membersOmanOther small statesPacific island small statesPakistanPalauPanamaPapua New GuineaParaguayPeruPhilippinesPolandPortugalPost-demographic dividendPre-demographic dividendPuerto RicoQatarRomaniaRussian FederationRwandaSamoaSan MarinoSao Tome and PrincipeSaudi ArabiaSenegalSerbiaSeychellesSierra LeoneSlovak RepublicSloveniaSmall statesSolomon IslandsSomaliaSouth AfricaSouth AsiaSouth Asia (IDA & IBRD)SpainSri LankaSt. Kitts and NevisSt. LuciaSt. Vincent and the GrenadinesSub-Saharan Africa Sub-Saharan Africa (excluding high income)Sub-Saharan Africa (IDA & IBRD countries)SudanSurinameSwazilandSwedenSwitzerlandSyrian Arab RepublicTajikistanTanzaniaThailandTimor-LesteTogoTongaTrinidad and TobagoTunisiaTurkeyTurkmenistanTuvaluUgandaUkraineUnited Arab EmiratesUnited KingdomUnited StatesUpper middle incomeUruguayUzbekistanVanuatuVenezuela, RBVietnamWest Bank and GazaWorldYemen, Rep.ZambiaZimbabwe Timeline:
This timeline shows a graph from 1972 to 2015 of France. No data until 1971. Number of actual observations by date: 42.
Source name:
World Development Indicators
Source organization:
United Nations Educational, Scientific, and Cultural Organization (UNESCO) Institute for Statistics.
Categories, topics:
Education, Gender
Last updated:
apr 23, 2017
Indicators value changes by year
Minimum:
70.919
jan 1, 1972
Maximum:
114.731
jan 1, 1996
At the date of observation
Value
Absolute change
Change from previous value
jan 1, 1972
70.919
+70.919
0.0%
jan 1, 1973
74.608
+3.689
5.2%
jan 1, 1974
77.908
+3.3
4.42%
jan 1, 1975
84.492
+6.584
8.45%
jan 1, 1976
80.118
-4.374
-5.18%
jan 1, 1978
79.039
-1.079
-1.35%
jan 1, 1979
78.394
-0.645
-0.82%
jan 1, 1980
78.826
+0.432
0.55%
jan 1, 1981
79.41
+0.585
0.74%
jan 1, 1982
76.87
-2.54
-3.2%
jan 1, 1983
80.631
+3.761
4.89%
jan 1, 1984
82.1
+1.468
1.82%
jan 1, 1986
86.051
+3.952
4.81%
jan 1, 1987
87.137
+1.086
1.26%
jan 1, 1988
88.525
+1.388
1.59%
jan 1, 1989
89.717
+1.192
1.35%
jan 1, 1990
91.455
+1.738
1.94%
jan 1, 1991
93.742
+2.287
2.5%
jan 1, 1992
98.854
+5.111
5.45%
jan 1, 1993
102.751
+3.897
3.94%
jan 1, 1994
103.733
+0.983
0.96%
jan 1, 1995
114.324
+10.591
10.21%
jan 1, 1996
114.731
+0.407
0.36%
jan 1, 1997
113.099
-1.632
-1.42%
jan 1, 1998
112.006
-1.093
-0.97%
jan 1, 1999
110.957
-1.049
-0.94%
jan 1, 2000
109.83
-1.127
-1.02%
jan 1, 2001
108.939
-0.891
-0.81%
jan 1, 2002
107.826
-1.113
-1.02%
jan 1, 2003
107.621
-0.205
-0.19%
jan 1, 2004
107.855
+0.235
0.22%
jan 1, 2005
107.806
-0.049
-0.05%
jan 1, 2006
112.199
+4.392
4.07%
jan 1, 2007
112.084
-0.115
-0.1%
jan 1, 2008
111.837
-0.246
-0.22%
jan 1, 2009
111.632
-0.205
-0.18%
jan 1, 2010
111.138
-0.494
-0.44%
jan 1, 2011
111.005
-0.134
-0.12%
jan 1, 2012
110.989
-0.016
-0.01%
jan 1, 2013
111.597
+0.608
0.55%
jan 1, 2014
110.562
-1.035
-0.93%
jan 1, 2015
110.079
-0.483
-0.44%
Ranking of countries by current statistics by years


Comments: