29
/
en
AIzaSyAYiBZKx7MnpbEhh9jyipgxe19OcubqV5w
April 1, 2024
78935
Bangladesh
BGD
true
2
1
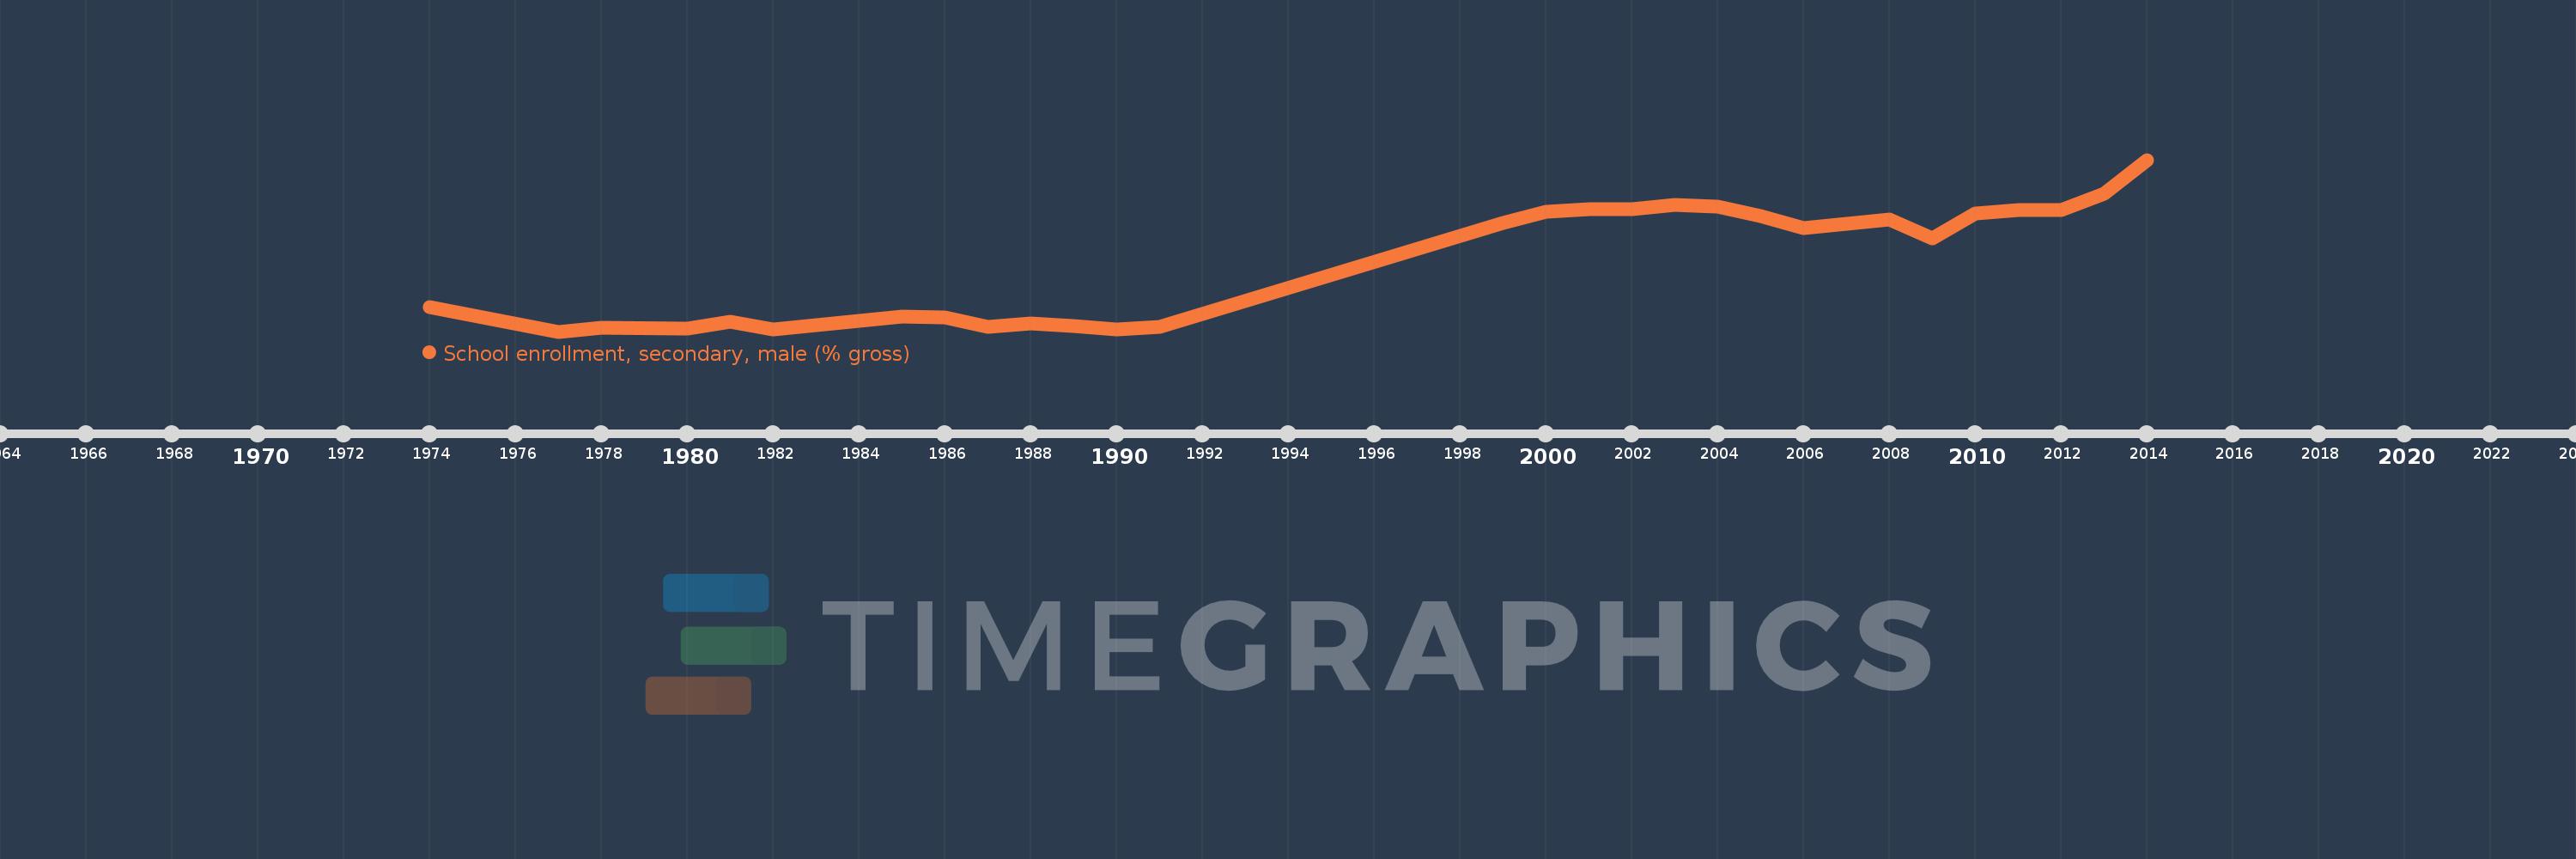
School enrollment, secondary, male (% gross)
2014,2013,2012,2011,2010,2009,2008,2007,2006,2005,2004,2003,2002,2001,2000,1999,1991,1990,1989,1988,1987,1986,1985,1982,1981,1980,1978,1977,1974
This statistics in other country:
AfghanistanAlbaniaAlgeriaAndorraAngolaAntigua and BarbudaArab WorldArgentinaArmeniaArubaAustraliaAustriaAzerbaijanBahamas, TheBahrainBangladeshBarbadosBelarusBelgiumBelizeBeninBermudaBhutanBoliviaBosnia and HerzegovinaBotswanaBrazilBrunei DarussalamBulgariaBurkina FasoBurundiCabo VerdeCambodiaCameroonCanadaCaribbean small statesCentral African RepublicCentral Europe and the BalticsChadChileChinaColombiaComorosCongo, Dem. Rep.Congo, Rep.Costa RicaCote d'IvoireCroatiaCubaCuracaoCyprusCzech RepublicDenmarkDjiboutiDominicaDominican RepublicEarly-demographic dividendEast Asia & PacificEast Asia & Pacific (excluding high income)East Asia & Pacific (IDA & IBRD countries)EcuadorEgypt, Arab Rep.El SalvadorEquatorial GuineaEritreaEstoniaEthiopiaEuro areaEurope & Central AsiaEurope & Central Asia (excluding high income)Europe & Central Asia (IDA & IBRD countries)European UnionFijiFinlandFragile and conflict affected situationsFranceGabonGambia, TheGeorgiaGermanyGhanaGreeceGrenadaGuatemalaGuineaGuinea-BissauGuyanaHeavily indebted poor countries (HIPC)High incomeHondurasHong Kong SAR, ChinaHungaryIBRD onlyIcelandIDA & IBRD totalIDA blendIDA onlyIDA totalIndiaIndonesiaIran, Islamic Rep.IraqIrelandIsraelItalyJamaicaJapanJordanKazakhstanKenyaKiribatiKorea, Dem. People’s Rep.Korea, Rep.KuwaitKyrgyz RepublicLao PDRLate-demographic dividendLatin America & Caribbean Latin America & Caribbean (excluding high income)Latin America & the Caribbean (IDA & IBRD countries)LatviaLeast developed countries: UN classificationLebanonLesothoLiberiaLibyaLiechtensteinLithuaniaLow & middle incomeLow incomeLower middle incomeLuxembourgMacao SAR, ChinaMacedonia, FYRMadagascarMalawiMaldivesMaliMaltaMarshall IslandsMauritaniaMauritiusMexicoMicronesia, Fed. Sts.Middle East & North AfricaMiddle East & North Africa (excluding high income)Middle East & North Africa (IDA & IBRD countries)Middle incomeMoldovaMongoliaMontenegroMoroccoMozambiqueMyanmarNamibiaNauruNepalNetherlandsNew ZealandNicaraguaNigerNigeriaNorth AmericaNorwayOECD membersOmanOther small statesPacific island small statesPakistanPalauPanamaPapua New GuineaParaguayPeruPhilippinesPolandPortugalPost-demographic dividendPre-demographic dividendPuerto RicoQatarRomaniaRussian FederationRwandaSamoaSan MarinoSao Tome and PrincipeSaudi ArabiaSenegalSerbiaSeychellesSierra LeoneSlovak RepublicSloveniaSmall statesSolomon IslandsSomaliaSouth AfricaSouth AsiaSouth Asia (IDA & IBRD)SpainSri LankaSt. Kitts and NevisSt. LuciaSt. Vincent and the GrenadinesSub-Saharan Africa Sub-Saharan Africa (excluding high income)Sub-Saharan Africa (IDA & IBRD countries)SudanSurinameSwazilandSwedenSwitzerlandSyrian Arab RepublicTajikistanTanzaniaThailandTimor-LesteTogoTongaTrinidad and TobagoTunisiaTurkeyTurkmenistanTuvaluUgandaUkraineUnited Arab EmiratesUnited KingdomUnited StatesUpper middle incomeUruguayUzbekistanVanuatuVenezuela, RBVietnamWest Bank and GazaWorldYemen, Rep.ZambiaZimbabwe Timeline:
This timeline shows a graph from 1974 to 2014 of Bangladesh. No data until 1973. Number of actual observations by date: 29.
Source name:
World Development Indicators
Source organization:
United Nations Educational, Scientific, and Cultural Organization (UNESCO) Institute for Statistics.
Categories, topics:
Education, Gender
Last updated:
apr 23, 2017
Indicators value changes by year
Minimum:
25.998
jan 1, 1977
Maximum:
56.065
jan 1, 2014
At the date of observation
Value
Absolute change
Change from previous value
jan 1, 1974
30.295
+30.295
0.0%
jan 1, 1977
25.998
-4.297
-14.18%
jan 1, 1978
26.703
+0.705
2.71%
jan 1, 1980
26.461
-0.242
-0.91%
jan 1, 1981
27.726
+1.265
4.78%
jan 1, 1982
26.313
-1.414
-5.1%
jan 1, 1985
28.673
+2.36
8.97%
jan 1, 1986
28.446
-0.226
-0.79%
jan 1, 1987
26.755
-1.691
-5.95%
jan 1, 1988
27.437
+0.682
2.55%
jan 1, 1989
26.964
-0.473
-1.72%
jan 1, 1990
26.443
-0.521
-1.93%
jan 1, 1991
26.844
+0.401
1.52%
jan 1, 1999
44.977
+18.133
67.55%
jan 1, 2000
46.932
+1.955
4.35%
jan 1, 2001
47.438
+0.506
1.08%
jan 1, 2002
47.472
+0.034
0.07%
jan 1, 2003
48.144
+0.671
1.41%
jan 1, 2004
47.935
-0.209
-0.43%
jan 1, 2005
46.246
-1.689
-3.52%
jan 1, 2006
44.096
-2.151
-4.65%
jan 1, 2007
44.852
+0.756
1.72%
jan 1, 2008
45.678
+0.826
1.84%
jan 1, 2009
42.288
-3.39
-7.42%
jan 1, 2010
46.737
+4.449
10.52%
jan 1, 2011
47.272
+0.535
1.15%
jan 1, 2012
47.342
+0.069
0.15%
jan 1, 2013
50.162
+2.82
5.96%
jan 1, 2014
56.065
+5.903
11.77%
Ranking of countries by current statistics by years


Comments: