29
/
en
AIzaSyAYiBZKx7MnpbEhh9jyipgxe19OcubqV5w
April 1, 2024
28688
East Asia & Pacific (excluding high income)
EAP
false
2
1
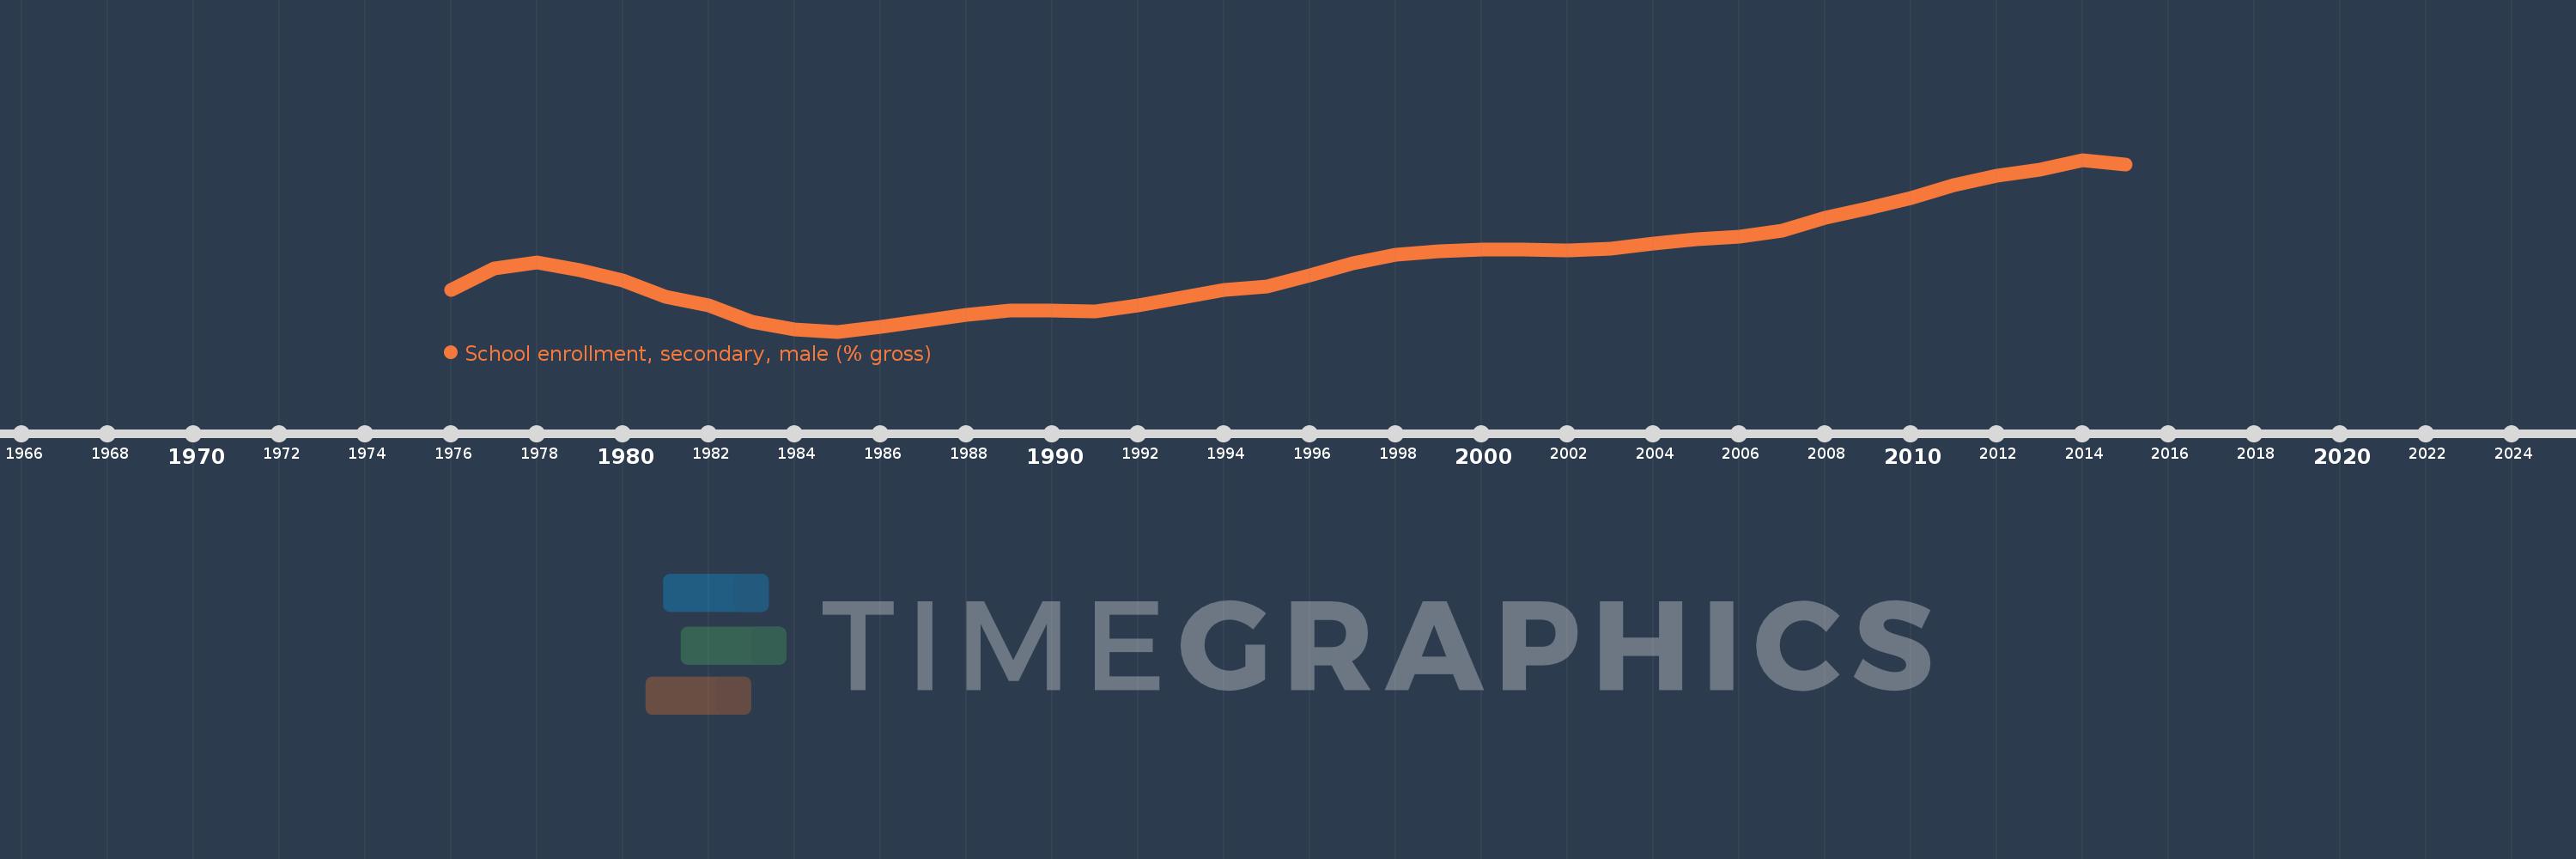
School enrollment, secondary, male (% gross)
2015,2014,2013,2012,2011,2010,2009,2008,2007,2006,2005,2004,2003,2002,2001,2000,1999,1998,1997,1996,1995,1994,1993,1992,1991,1990,1989,1988,1987,1986,1985,1984,1983,1982,1981,1980,1979,1978,1977,1976
This statistics in other country:
AfghanistanAlbaniaAlgeriaAndorraAngolaAntigua and BarbudaArab WorldArgentinaArmeniaArubaAustraliaAustriaAzerbaijanBahamas, TheBahrainBangladeshBarbadosBelarusBelgiumBelizeBeninBermudaBhutanBoliviaBosnia and HerzegovinaBotswanaBrazilBrunei DarussalamBulgariaBurkina FasoBurundiCabo VerdeCambodiaCameroonCanadaCaribbean small statesCentral African RepublicCentral Europe and the BalticsChadChileChinaColombiaComorosCongo, Dem. Rep.Congo, Rep.Costa RicaCote d'IvoireCroatiaCubaCuracaoCyprusCzech RepublicDenmarkDjiboutiDominicaDominican RepublicEarly-demographic dividendEast Asia & PacificEast Asia & Pacific (excluding high income)East Asia & Pacific (IDA & IBRD countries)EcuadorEgypt, Arab Rep.El SalvadorEquatorial GuineaEritreaEstoniaEthiopiaEuro areaEurope & Central AsiaEurope & Central Asia (excluding high income)Europe & Central Asia (IDA & IBRD countries)European UnionFijiFinlandFragile and conflict affected situationsFranceGabonGambia, TheGeorgiaGermanyGhanaGreeceGrenadaGuatemalaGuineaGuinea-BissauGuyanaHeavily indebted poor countries (HIPC)High incomeHondurasHong Kong SAR, ChinaHungaryIBRD onlyIcelandIDA & IBRD totalIDA blendIDA onlyIDA totalIndiaIndonesiaIran, Islamic Rep.IraqIrelandIsraelItalyJamaicaJapanJordanKazakhstanKenyaKiribatiKorea, Dem. People’s Rep.Korea, Rep.KuwaitKyrgyz RepublicLao PDRLate-demographic dividendLatin America & Caribbean Latin America & Caribbean (excluding high income)Latin America & the Caribbean (IDA & IBRD countries)LatviaLeast developed countries: UN classificationLebanonLesothoLiberiaLibyaLiechtensteinLithuaniaLow & middle incomeLow incomeLower middle incomeLuxembourgMacao SAR, ChinaMacedonia, FYRMadagascarMalawiMaldivesMaliMaltaMarshall IslandsMauritaniaMauritiusMexicoMicronesia, Fed. Sts.Middle East & North AfricaMiddle East & North Africa (excluding high income)Middle East & North Africa (IDA & IBRD countries)Middle incomeMoldovaMongoliaMontenegroMoroccoMozambiqueMyanmarNamibiaNauruNepalNetherlandsNew ZealandNicaraguaNigerNigeriaNorth AmericaNorwayOECD membersOmanOther small statesPacific island small statesPakistanPalauPanamaPapua New GuineaParaguayPeruPhilippinesPolandPortugalPost-demographic dividendPre-demographic dividendPuerto RicoQatarRomaniaRussian FederationRwandaSamoaSan MarinoSao Tome and PrincipeSaudi ArabiaSenegalSerbiaSeychellesSierra LeoneSlovak RepublicSloveniaSmall statesSolomon IslandsSomaliaSouth AfricaSouth AsiaSouth Asia (IDA & IBRD)SpainSri LankaSt. Kitts and NevisSt. LuciaSt. Vincent and the GrenadinesSub-Saharan Africa Sub-Saharan Africa (excluding high income)Sub-Saharan Africa (IDA & IBRD countries)SudanSurinameSwazilandSwedenSwitzerlandSyrian Arab RepublicTajikistanTanzaniaThailandTimor-LesteTogoTongaTrinidad and TobagoTunisiaTurkeyTurkmenistanTuvaluUgandaUkraineUnited Arab EmiratesUnited KingdomUnited StatesUpper middle incomeUruguayUzbekistanVanuatuVenezuela, RBVietnamWest Bank and GazaWorldYemen, Rep.ZambiaZimbabwe Timeline:
This timeline shows a graph from 1976 to 2015 of East Asia & Pacific (excluding high income). No data until 1975. Number of actual observations by date: 40.
Source name:
World Development Indicators
Source organization:
United Nations Educational, Scientific, and Cultural Organization (UNESCO) Institute for Statistics.
Categories, topics:
Education, Gender
Last updated:
apr 23, 2017
Indicators value changes by year
Minimum:
37.698
jan 1, 1985
Maximum:
87.377
jan 1, 2014
At the date of observation
Value
Absolute change
Change from previous value
jan 1, 1976
49.636
+49.636
0.0%
jan 1, 1977
55.93
+6.294
12.68%
jan 1, 1978
57.807
+1.877
3.36%
jan 1, 1979
55.531
-2.276
-3.94%
jan 1, 1980
52.599
-2.932
-5.28%
jan 1, 1981
47.825
-4.774
-9.08%
jan 1, 1982
45.153
-2.672
-5.59%
jan 1, 1983
40.532
-4.621
-10.23%
jan 1, 1984
38.273
-2.259
-5.57%
jan 1, 1985
37.698
-0.575
-1.5%
jan 1, 1986
38.953
+1.255
3.33%
jan 1, 1987
40.695
+1.742
4.47%
jan 1, 1988
42.595
+1.901
4.67%
jan 1, 1989
43.89
+1.294
3.04%
jan 1, 1990
43.898
+0.008
0.02%
jan 1, 1991
43.623
-0.275
-0.63%
jan 1, 1992
45.322
+1.7
3.9%
jan 1, 1993
47.575
+2.253
4.97%
jan 1, 1994
49.857
+2.282
4.8%
jan 1, 1995
50.744
+0.886
1.78%
jan 1, 1996
53.911
+3.167
6.24%
jan 1, 1997
57.454
+3.543
6.57%
jan 1, 1998
60.005
+2.55
4.44%
jan 1, 1999
60.945
+0.94
1.57%
jan 1, 2000
61.434
+0.489
0.8%
jan 1, 2001
61.306
-0.128
-0.21%
jan 1, 2002
61.244
-0.062
-0.1%
jan 1, 2003
61.584
+0.34
0.55%
jan 1, 2004
63.115
+1.531
2.49%
jan 1, 2005
64.411
+1.295
2.05%
jan 1, 2006
65.183
+0.773
1.2%
jan 1, 2007
66.974
+1.791
2.75%
jan 1, 2008
70.727
+3.752
5.6%
jan 1, 2009
73.254
+2.527
3.57%
jan 1, 2010
76.241
+2.987
4.08%
jan 1, 2011
79.973
+3.732
4.89%
jan 1, 2012
82.843
+2.87
3.59%
jan 1, 2013
84.619
+1.776
2.14%
jan 1, 2014
87.377
+2.758
3.26%
jan 1, 2015
86.059
-1.318
-1.51%
Ranking of countries by current statistics by years


Comments: