29
/
en
AIzaSyAYiBZKx7MnpbEhh9jyipgxe19OcubqV5w
April 1, 2024
170474
Korea, Rep.
KOR
true
2
1
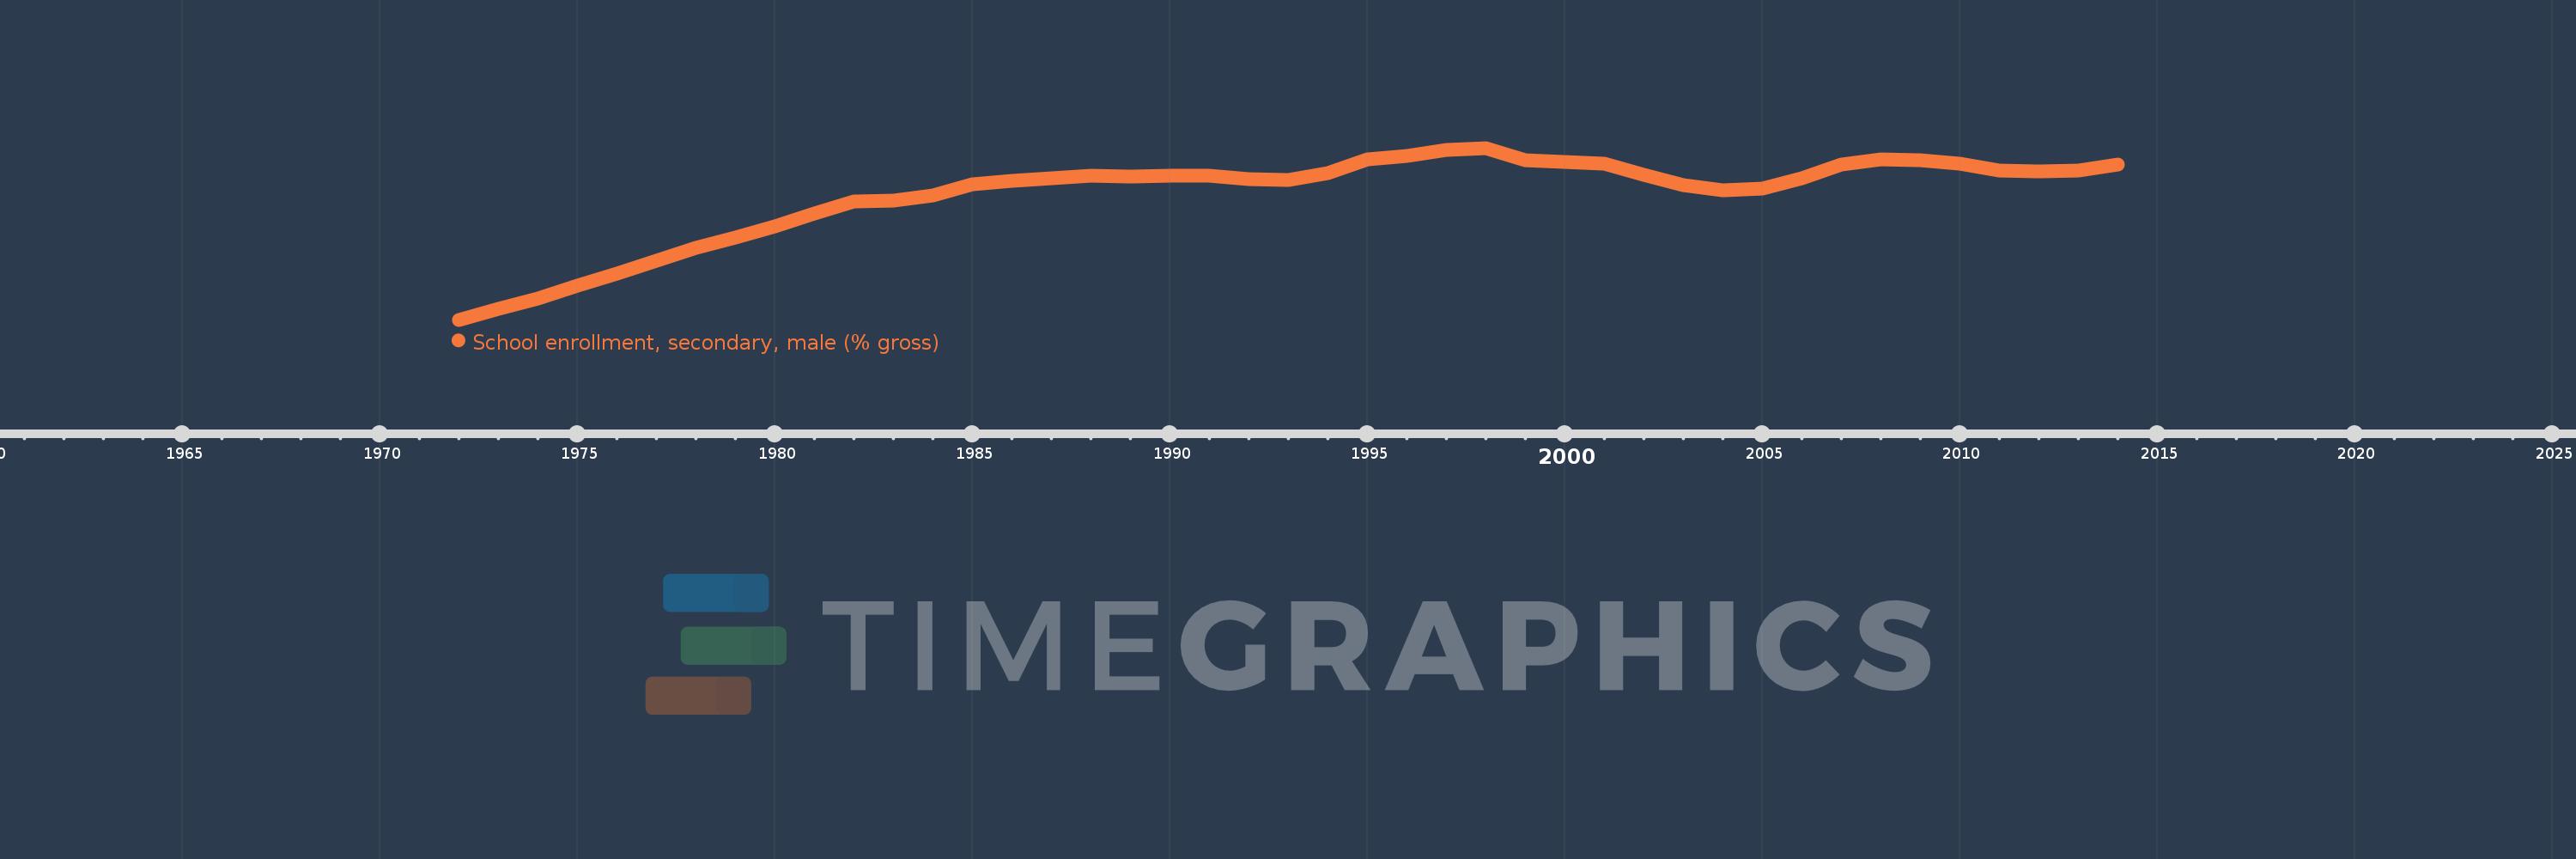
School enrollment, secondary, male (% gross)
2014,2013,2012,2011,2010,2009,2008,2007,2006,2005,2004,2003,2002,2001,2000,1999,1998,1997,1996,1995,1994,1993,1992,1991,1990,1989,1988,1987,1986,1985,1984,1983,1982,1981,1980,1979,1978,1977,1976,1975,1974,1973,1972
This statistics in other country:
AfghanistanAlbaniaAlgeriaAndorraAngolaAntigua and BarbudaArab WorldArgentinaArmeniaArubaAustraliaAustriaAzerbaijanBahamas, TheBahrainBangladeshBarbadosBelarusBelgiumBelizeBeninBermudaBhutanBoliviaBosnia and HerzegovinaBotswanaBrazilBrunei DarussalamBulgariaBurkina FasoBurundiCabo VerdeCambodiaCameroonCanadaCaribbean small statesCentral African RepublicCentral Europe and the BalticsChadChileChinaColombiaComorosCongo, Dem. Rep.Congo, Rep.Costa RicaCote d'IvoireCroatiaCubaCuracaoCyprusCzech RepublicDenmarkDjiboutiDominicaDominican RepublicEarly-demographic dividendEast Asia & PacificEast Asia & Pacific (excluding high income)East Asia & Pacific (IDA & IBRD countries)EcuadorEgypt, Arab Rep.El SalvadorEquatorial GuineaEritreaEstoniaEthiopiaEuro areaEurope & Central AsiaEurope & Central Asia (excluding high income)Europe & Central Asia (IDA & IBRD countries)European UnionFijiFinlandFragile and conflict affected situationsFranceGabonGambia, TheGeorgiaGermanyGhanaGreeceGrenadaGuatemalaGuineaGuinea-BissauGuyanaHeavily indebted poor countries (HIPC)High incomeHondurasHong Kong SAR, ChinaHungaryIBRD onlyIcelandIDA & IBRD totalIDA blendIDA onlyIDA totalIndiaIndonesiaIran, Islamic Rep.IraqIrelandIsraelItalyJamaicaJapanJordanKazakhstanKenyaKiribatiKorea, Dem. People’s Rep.Korea, Rep.KuwaitKyrgyz RepublicLao PDRLate-demographic dividendLatin America & Caribbean Latin America & Caribbean (excluding high income)Latin America & the Caribbean (IDA & IBRD countries)LatviaLeast developed countries: UN classificationLebanonLesothoLiberiaLibyaLiechtensteinLithuaniaLow & middle incomeLow incomeLower middle incomeLuxembourgMacao SAR, ChinaMacedonia, FYRMadagascarMalawiMaldivesMaliMaltaMarshall IslandsMauritaniaMauritiusMexicoMicronesia, Fed. Sts.Middle East & North AfricaMiddle East & North Africa (excluding high income)Middle East & North Africa (IDA & IBRD countries)Middle incomeMoldovaMongoliaMontenegroMoroccoMozambiqueMyanmarNamibiaNauruNepalNetherlandsNew ZealandNicaraguaNigerNigeriaNorth AmericaNorwayOECD membersOmanOther small statesPacific island small statesPakistanPalauPanamaPapua New GuineaParaguayPeruPhilippinesPolandPortugalPost-demographic dividendPre-demographic dividendPuerto RicoQatarRomaniaRussian FederationRwandaSamoaSan MarinoSao Tome and PrincipeSaudi ArabiaSenegalSerbiaSeychellesSierra LeoneSlovak RepublicSloveniaSmall statesSolomon IslandsSomaliaSouth AfricaSouth AsiaSouth Asia (IDA & IBRD)SpainSri LankaSt. Kitts and NevisSt. LuciaSt. Vincent and the GrenadinesSub-Saharan Africa Sub-Saharan Africa (excluding high income)Sub-Saharan Africa (IDA & IBRD countries)SudanSurinameSwazilandSwedenSwitzerlandSyrian Arab RepublicTajikistanTanzaniaThailandTimor-LesteTogoTongaTrinidad and TobagoTunisiaTurkeyTurkmenistanTuvaluUgandaUkraineUnited Arab EmiratesUnited KingdomUnited StatesUpper middle incomeUruguayUzbekistanVanuatuVenezuela, RBVietnamWest Bank and GazaWorldYemen, Rep.ZambiaZimbabwe Timeline:
This timeline shows a graph from 1972 to 2014 of Korea, Rep.. No data until 1971. Number of actual observations by date: 43.
Source name:
World Development Indicators
Source organization:
United Nations Educational, Scientific, and Cultural Organization (UNESCO) Institute for Statistics.
Categories, topics:
Education, Gender
Last updated:
apr 23, 2017
Indicators value changes by year
Minimum:
48.017
jan 1, 1972
Maximum:
103.774
jan 1, 1998
At the date of observation
Value
Absolute change
Change from previous value
jan 1, 1972
48.017
+48.017
0.0%
jan 1, 1973
51.466
+3.449
7.18%
jan 1, 1974
54.823
+3.357
6.52%
jan 1, 1975
58.968
+4.145
7.56%
jan 1, 1976
62.92
+3.952
6.7%
jan 1, 1977
67.261
+4.341
6.9%
jan 1, 1978
71.471
+4.21
6.26%
jan 1, 1979
74.74
+3.269
4.57%
jan 1, 1980
78.349
+3.609
4.83%
jan 1, 1981
82.638
+4.289
5.47%
jan 1, 1982
86.405
+3.767
4.56%
jan 1, 1983
86.791
+0.386
0.45%
jan 1, 1984
88.37
+1.579
1.82%
jan 1, 1985
91.906
+3.536
4.0%
jan 1, 1986
93.092
+1.186
1.29%
jan 1, 1987
94.043
+0.952
1.02%
jan 1, 1988
94.808
+0.765
0.81%
jan 1, 1989
94.569
-0.24
-0.25%
jan 1, 1990
94.812
+0.243
0.26%
jan 1, 1991
94.733
-0.079
-0.08%
jan 1, 1992
93.757
-0.976
-1.03%
jan 1, 1993
93.451
-0.306
-0.33%
jan 1, 1994
95.543
+2.092
2.24%
jan 1, 1995
99.928
+4.386
4.59%
jan 1, 1996
101.147
+1.219
1.22%
jan 1, 1997
103.146
+1.999
1.98%
jan 1, 1998
103.774
+0.628
0.61%
jan 1, 1999
99.904
-3.87
-3.73%
jan 1, 2000
99.287
-0.617
-0.62%
jan 1, 2001
98.547
-0.74
-0.75%
jan 1, 2002
94.947
-3.599
-3.65%
jan 1, 2003
91.775
-3.172
-3.34%
jan 1, 2004
90.128
-1.647
-1.79%
jan 1, 2005
90.716
+0.588
0.65%
jan 1, 2006
93.921
+3.205
3.53%
jan 1, 2007
98.307
+4.386
4.67%
jan 1, 2008
100.029
+1.722
1.75%
jan 1, 2009
99.833
-0.196
-0.2%
jan 1, 2010
98.694
-1.14
-1.14%
jan 1, 2011
96.356
-2.338
-2.37%
jan 1, 2012
96.173
-0.183
-0.19%
jan 1, 2013
96.569
+0.396
0.41%
jan 1, 2014
98.259
+1.69
1.75%
Ranking of countries by current statistics by years


Comments: