29
/
en
AIzaSyAYiBZKx7MnpbEhh9jyipgxe19OcubqV5w
April 1, 2024
178276
Lesotho
LSO
true
2
1
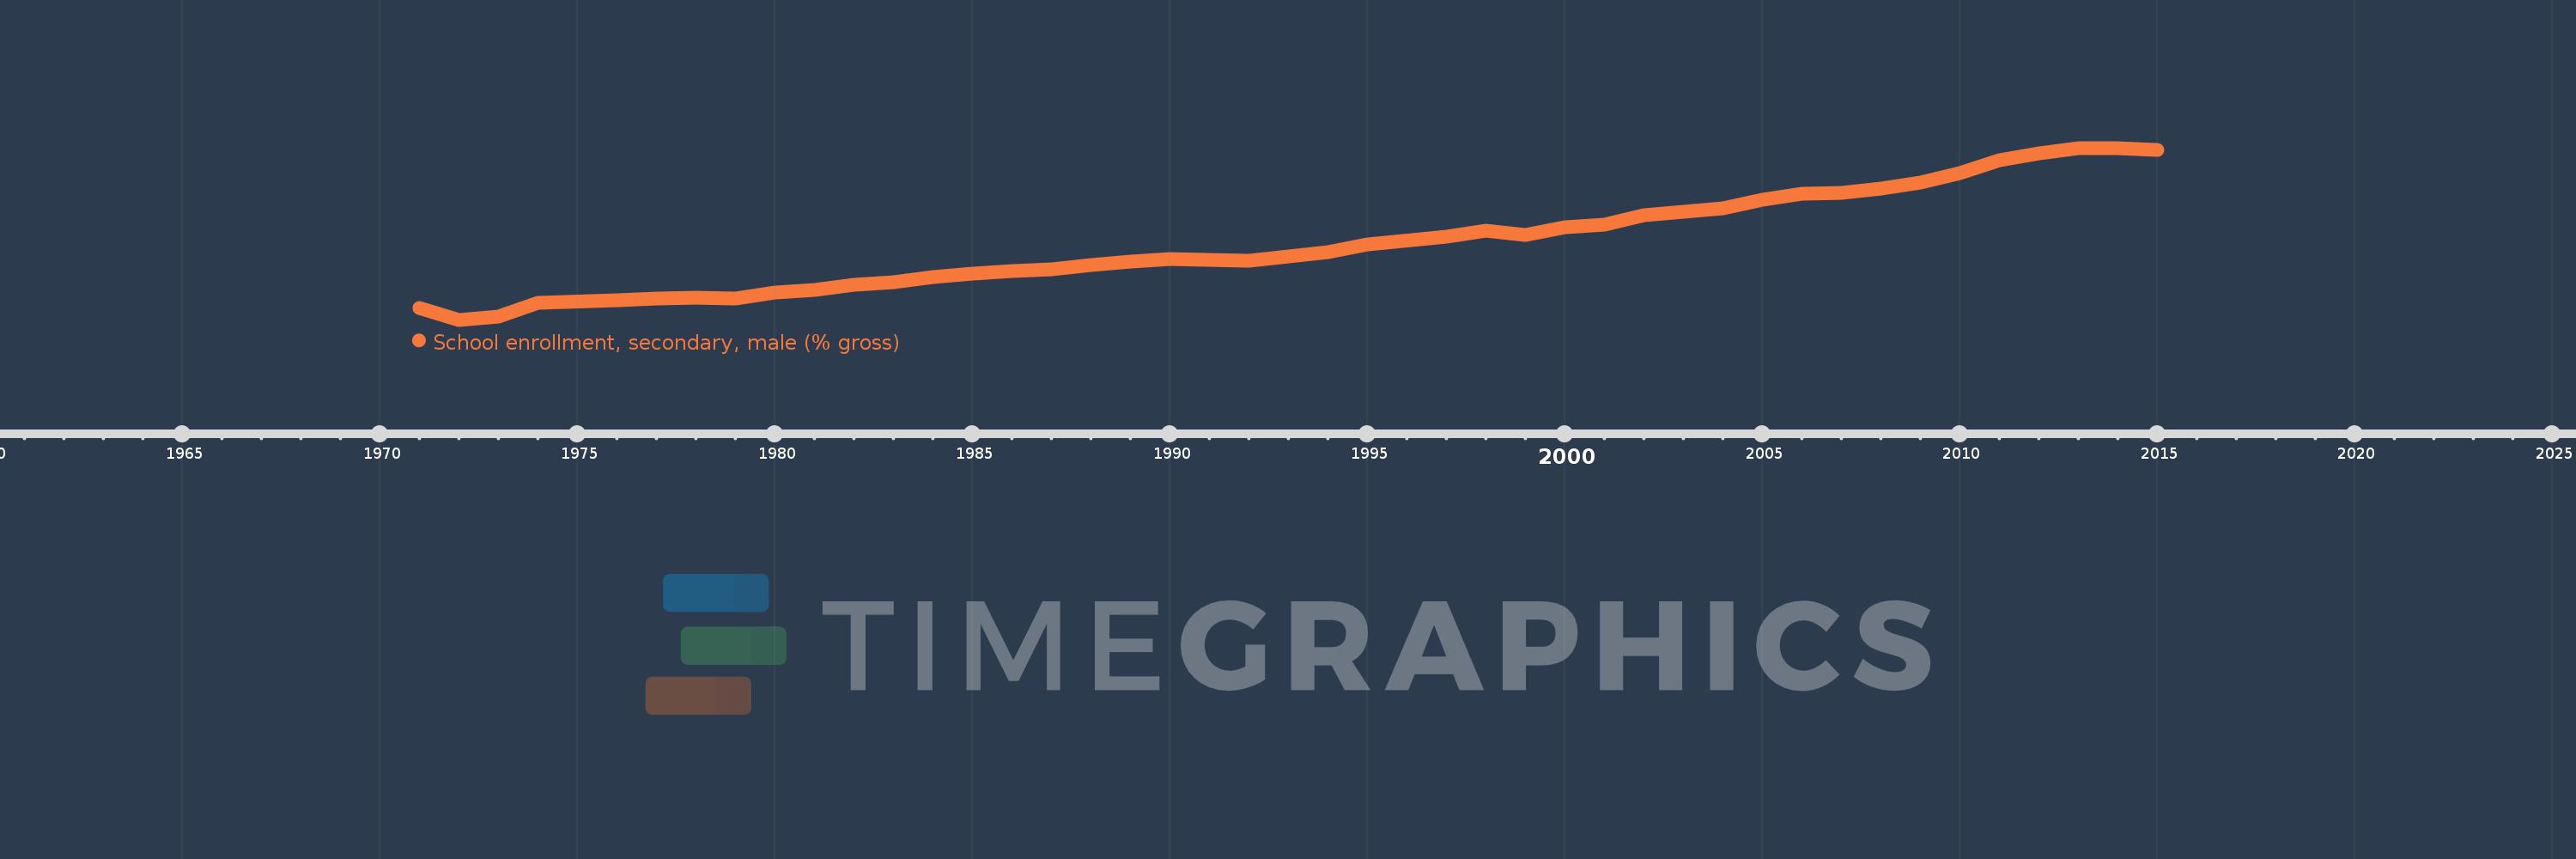
School enrollment, secondary, male (% gross)
2015,2014,2013,2012,2011,2010,2009,2008,2007,2006,2005,2004,2003,2002,2001,2000,1999,1998,1997,1995,1994,1993,1992,1991,1990,1989,1988,1987,1986,1985,1984,1983,1982,1981,1980,1979,1978,1977,1976,1974,1973,1972,1971
This statistics in other country:
AfghanistanAlbaniaAlgeriaAndorraAngolaAntigua and BarbudaArab WorldArgentinaArmeniaArubaAustraliaAustriaAzerbaijanBahamas, TheBahrainBangladeshBarbadosBelarusBelgiumBelizeBeninBermudaBhutanBoliviaBosnia and HerzegovinaBotswanaBrazilBrunei DarussalamBulgariaBurkina FasoBurundiCabo VerdeCambodiaCameroonCanadaCaribbean small statesCentral African RepublicCentral Europe and the BalticsChadChileChinaColombiaComorosCongo, Dem. Rep.Congo, Rep.Costa RicaCote d'IvoireCroatiaCubaCuracaoCyprusCzech RepublicDenmarkDjiboutiDominicaDominican RepublicEarly-demographic dividendEast Asia & PacificEast Asia & Pacific (excluding high income)East Asia & Pacific (IDA & IBRD countries)EcuadorEgypt, Arab Rep.El SalvadorEquatorial GuineaEritreaEstoniaEthiopiaEuro areaEurope & Central AsiaEurope & Central Asia (excluding high income)Europe & Central Asia (IDA & IBRD countries)European UnionFijiFinlandFragile and conflict affected situationsFranceGabonGambia, TheGeorgiaGermanyGhanaGreeceGrenadaGuatemalaGuineaGuinea-BissauGuyanaHeavily indebted poor countries (HIPC)High incomeHondurasHong Kong SAR, ChinaHungaryIBRD onlyIcelandIDA & IBRD totalIDA blendIDA onlyIDA totalIndiaIndonesiaIran, Islamic Rep.IraqIrelandIsraelItalyJamaicaJapanJordanKazakhstanKenyaKiribatiKorea, Dem. People’s Rep.Korea, Rep.KuwaitKyrgyz RepublicLao PDRLate-demographic dividendLatin America & Caribbean Latin America & Caribbean (excluding high income)Latin America & the Caribbean (IDA & IBRD countries)LatviaLeast developed countries: UN classificationLebanonLesothoLiberiaLibyaLiechtensteinLithuaniaLow & middle incomeLow incomeLower middle incomeLuxembourgMacao SAR, ChinaMacedonia, FYRMadagascarMalawiMaldivesMaliMaltaMarshall IslandsMauritaniaMauritiusMexicoMicronesia, Fed. Sts.Middle East & North AfricaMiddle East & North Africa (excluding high income)Middle East & North Africa (IDA & IBRD countries)Middle incomeMoldovaMongoliaMontenegroMoroccoMozambiqueMyanmarNamibiaNauruNepalNetherlandsNew ZealandNicaraguaNigerNigeriaNorth AmericaNorwayOECD membersOmanOther small statesPacific island small statesPakistanPalauPanamaPapua New GuineaParaguayPeruPhilippinesPolandPortugalPost-demographic dividendPre-demographic dividendPuerto RicoQatarRomaniaRussian FederationRwandaSamoaSan MarinoSao Tome and PrincipeSaudi ArabiaSenegalSerbiaSeychellesSierra LeoneSlovak RepublicSloveniaSmall statesSolomon IslandsSomaliaSouth AfricaSouth AsiaSouth Asia (IDA & IBRD)SpainSri LankaSt. Kitts and NevisSt. LuciaSt. Vincent and the GrenadinesSub-Saharan Africa Sub-Saharan Africa (excluding high income)Sub-Saharan Africa (IDA & IBRD countries)SudanSurinameSwazilandSwedenSwitzerlandSyrian Arab RepublicTajikistanTanzaniaThailandTimor-LesteTogoTongaTrinidad and TobagoTunisiaTurkeyTurkmenistanTuvaluUgandaUkraineUnited Arab EmiratesUnited KingdomUnited StatesUpper middle incomeUruguayUzbekistanVanuatuVenezuela, RBVietnamWest Bank and GazaWorldYemen, Rep.ZambiaZimbabwe Timeline:
This timeline shows a graph from 1971 to 2015 of Lesotho. No data until 1970. Number of actual observations by date: 43.
Source name:
World Development Indicators
Source organization:
United Nations Educational, Scientific, and Cultural Organization (UNESCO) Institute for Statistics.
Categories, topics:
Education, Gender
Last updated:
apr 23, 2017
Indicators value changes by year
Maximum:
44.501
jan 1, 2014
At the date of observation
Value
Absolute change
Change from previous value
jan 1, 1971
9.233
+9.233
0.0%
jan 1, 1972
6.636
-2.596
-28.12%
jan 1, 1973
7.298
+0.662
9.98%
jan 1, 1974
10.322
+3.024
41.43%
jan 1, 1976
10.972
+0.65
6.3%
jan 1, 1977
11.284
+0.312
2.85%
jan 1, 1978
11.444
+0.159
1.41%
jan 1, 1979
11.399
-0.045
-0.39%
jan 1, 1980
12.615
+1.216
10.67%
jan 1, 1981
13.214
+0.599
4.75%
jan 1, 1982
14.31
+1.096
8.29%
jan 1, 1983
14.94
+0.63
4.4%
jan 1, 1984
16.059
+1.119
7.49%
jan 1, 1985
16.888
+0.829
5.16%
jan 1, 1986
17.441
+0.553
3.27%
jan 1, 1987
17.736
+0.295
1.69%
jan 1, 1988
18.759
+1.023
5.77%
jan 1, 1989
19.45
+0.691
3.69%
jan 1, 1990
19.973
+0.523
2.69%
jan 1, 1991
19.831
-0.141
-0.71%
jan 1, 1992
19.719
-0.113
-0.57%
jan 1, 1993
20.608
+0.89
4.51%
jan 1, 1994
21.49
+0.881
4.28%
jan 1, 1995
23.272
+1.783
8.3%
jan 1, 1997
25.016
+1.744
7.49%
jan 1, 1998
26.309
+1.293
5.17%
jan 1, 1999
25.38
-0.929
-3.53%
jan 1, 2000
27.107
+1.727
6.8%
jan 1, 2001
27.522
+0.415
1.53%
jan 1, 2002
29.719
+2.197
7.98%
jan 1, 2003
30.515
+0.796
2.68%
jan 1, 2004
31.098
+0.582
1.91%
jan 1, 2005
33.073
+1.975
6.35%
jan 1, 2006
34.453
+1.38
4.17%
jan 1, 2007
34.626
+0.173
0.5%
jan 1, 2008
35.631
+1.005
2.9%
jan 1, 2009
36.909
+1.278
3.59%
jan 1, 2010
38.903
+1.994
5.4%
jan 1, 2011
41.701
+2.797
7.19%
jan 1, 2012
43.222
+1.522
3.65%
jan 1, 2013
44.501
+1.278
2.96%
jan 1, 2014
44.501
+0.0
0.0%
jan 1, 2015
44.089
-0.412
-0.93%
Ranking of countries by current statistics by years


Comments: