29
/
en
AIzaSyAYiBZKx7MnpbEhh9jyipgxe19OcubqV5w
April 1, 2024
156705
Indonesia
IDN
true
2
1
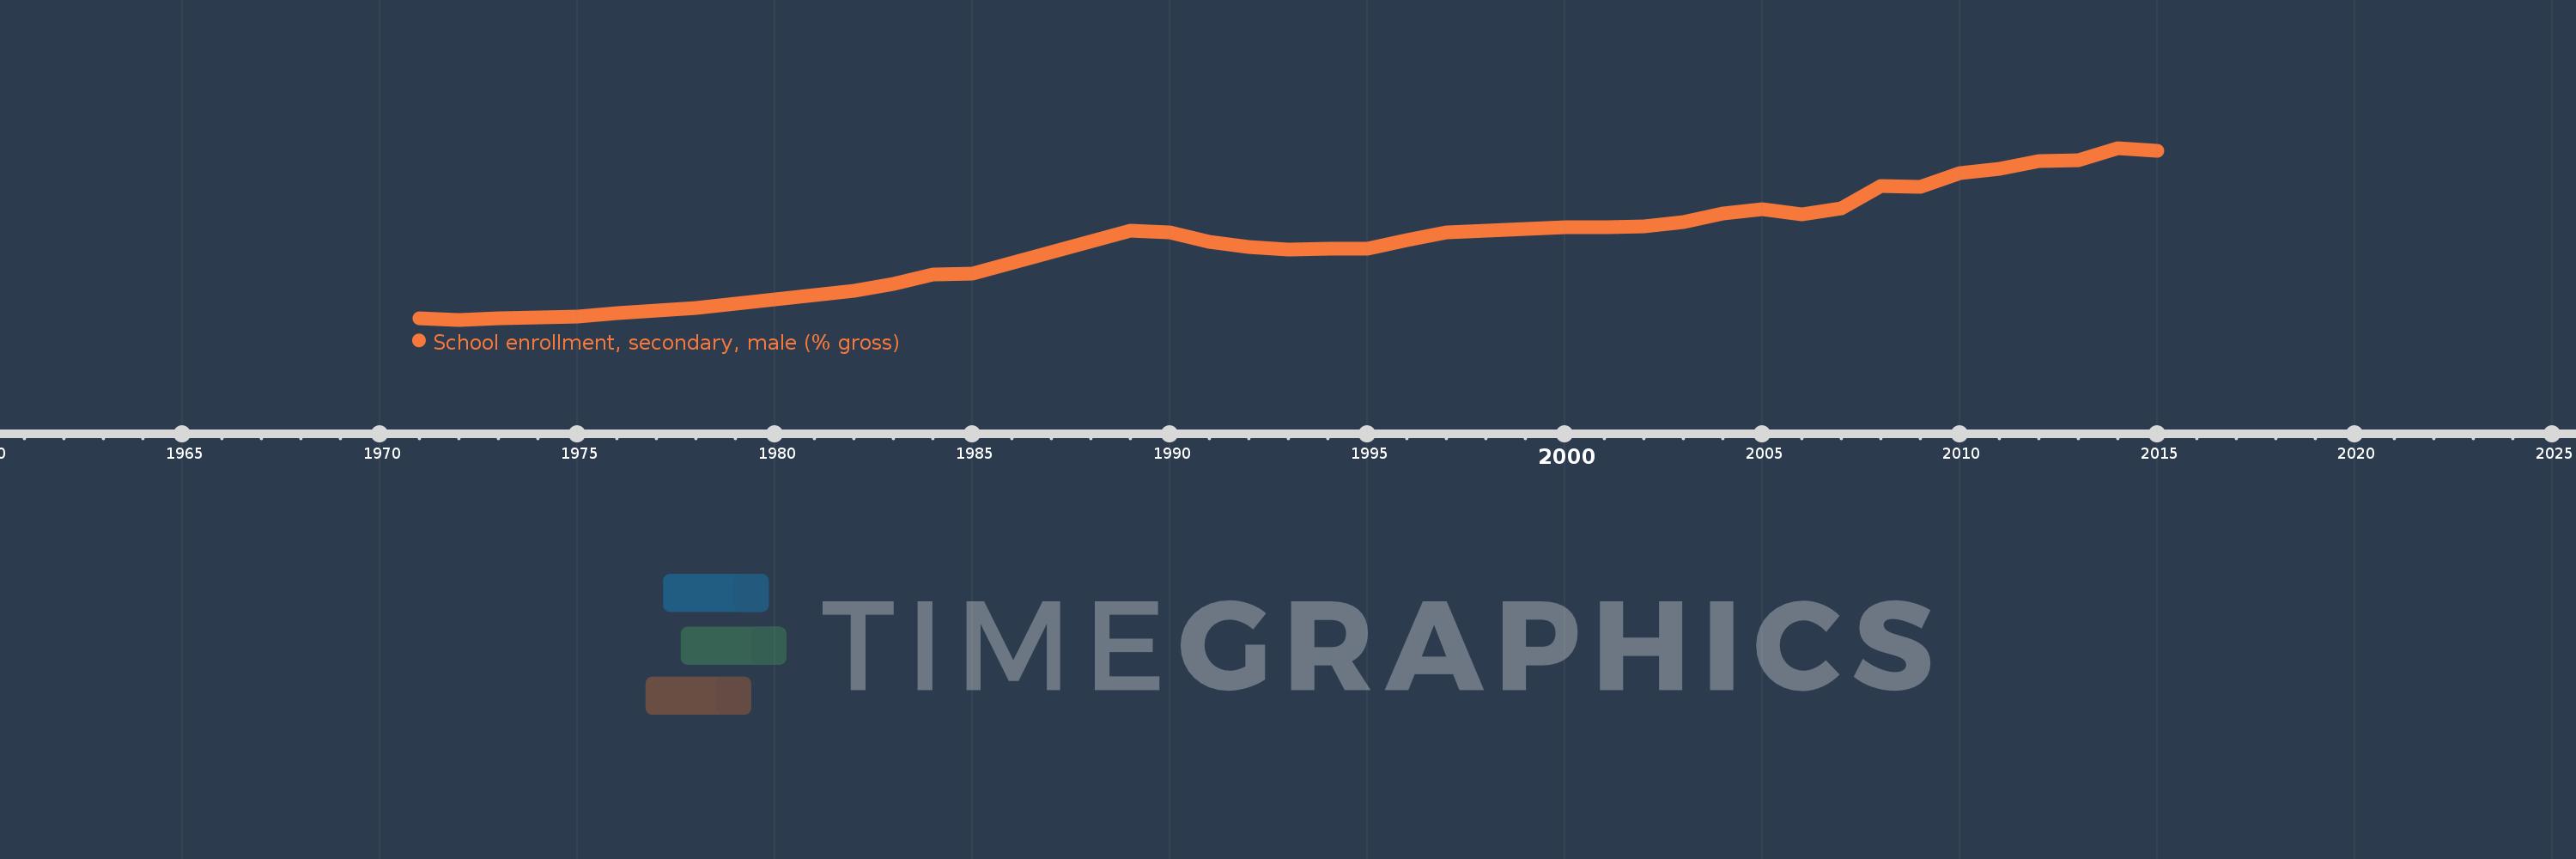
School enrollment, secondary, male (% gross)
2015,2014,2013,2012,2011,2010,2009,2008,2007,2006,2005,2004,2003,2002,2001,2000,1997,1996,1995,1994,1993,1992,1991,1990,1989,1985,1984,1983,1982,1979,1978,1977,1976,1975,1974,1973,1972,1971
This statistics in other country:
AfghanistanAlbaniaAlgeriaAndorraAngolaAntigua and BarbudaArab WorldArgentinaArmeniaArubaAustraliaAustriaAzerbaijanBahamas, TheBahrainBangladeshBarbadosBelarusBelgiumBelizeBeninBermudaBhutanBoliviaBosnia and HerzegovinaBotswanaBrazilBrunei DarussalamBulgariaBurkina FasoBurundiCabo VerdeCambodiaCameroonCanadaCaribbean small statesCentral African RepublicCentral Europe and the BalticsChadChileChinaColombiaComorosCongo, Dem. Rep.Congo, Rep.Costa RicaCote d'IvoireCroatiaCubaCuracaoCyprusCzech RepublicDenmarkDjiboutiDominicaDominican RepublicEarly-demographic dividendEast Asia & PacificEast Asia & Pacific (excluding high income)East Asia & Pacific (IDA & IBRD countries)EcuadorEgypt, Arab Rep.El SalvadorEquatorial GuineaEritreaEstoniaEthiopiaEuro areaEurope & Central AsiaEurope & Central Asia (excluding high income)Europe & Central Asia (IDA & IBRD countries)European UnionFijiFinlandFragile and conflict affected situationsFranceGabonGambia, TheGeorgiaGermanyGhanaGreeceGrenadaGuatemalaGuineaGuinea-BissauGuyanaHeavily indebted poor countries (HIPC)High incomeHondurasHong Kong SAR, ChinaHungaryIBRD onlyIcelandIDA & IBRD totalIDA blendIDA onlyIDA totalIndiaIndonesiaIran, Islamic Rep.IraqIrelandIsraelItalyJamaicaJapanJordanKazakhstanKenyaKiribatiKorea, Dem. People’s Rep.Korea, Rep.KuwaitKyrgyz RepublicLao PDRLate-demographic dividendLatin America & Caribbean Latin America & Caribbean (excluding high income)Latin America & the Caribbean (IDA & IBRD countries)LatviaLeast developed countries: UN classificationLebanonLesothoLiberiaLibyaLiechtensteinLithuaniaLow & middle incomeLow incomeLower middle incomeLuxembourgMacao SAR, ChinaMacedonia, FYRMadagascarMalawiMaldivesMaliMaltaMarshall IslandsMauritaniaMauritiusMexicoMicronesia, Fed. Sts.Middle East & North AfricaMiddle East & North Africa (excluding high income)Middle East & North Africa (IDA & IBRD countries)Middle incomeMoldovaMongoliaMontenegroMoroccoMozambiqueMyanmarNamibiaNauruNepalNetherlandsNew ZealandNicaraguaNigerNigeriaNorth AmericaNorwayOECD membersOmanOther small statesPacific island small statesPakistanPalauPanamaPapua New GuineaParaguayPeruPhilippinesPolandPortugalPost-demographic dividendPre-demographic dividendPuerto RicoQatarRomaniaRussian FederationRwandaSamoaSan MarinoSao Tome and PrincipeSaudi ArabiaSenegalSerbiaSeychellesSierra LeoneSlovak RepublicSloveniaSmall statesSolomon IslandsSomaliaSouth AfricaSouth AsiaSouth Asia (IDA & IBRD)SpainSri LankaSt. Kitts and NevisSt. LuciaSt. Vincent and the GrenadinesSub-Saharan Africa Sub-Saharan Africa (excluding high income)Sub-Saharan Africa (IDA & IBRD countries)SudanSurinameSwazilandSwedenSwitzerlandSyrian Arab RepublicTajikistanTanzaniaThailandTimor-LesteTogoTongaTrinidad and TobagoTunisiaTurkeyTurkmenistanTuvaluUgandaUkraineUnited Arab EmiratesUnited KingdomUnited StatesUpper middle incomeUruguayUzbekistanVanuatuVenezuela, RBVietnamWest Bank and GazaWorldYemen, Rep.ZambiaZimbabwe Timeline:
This timeline shows a graph from 1971 to 2015 of Indonesia. No data until 1970. Number of actual observations by date: 38.
Source name:
World Development Indicators
Source organization:
United Nations Educational, Scientific, and Cultural Organization (UNESCO) Institute for Statistics.
Categories, topics:
Education, Gender
Last updated:
apr 23, 2017
Indicators value changes by year
Minimum:
23.309
jan 1, 1972
Maximum:
83.709
jan 1, 2014
At the date of observation
Value
Absolute change
Change from previous value
jan 1, 1971
23.728
+23.728
0.0%
jan 1, 1972
23.309
-0.419
-1.77%
jan 1, 1973
23.691
+0.382
1.64%
jan 1, 1974
24.008
+0.317
1.34%
jan 1, 1975
24.443
+0.435
1.81%
jan 1, 1976
25.656
+1.213
4.96%
jan 1, 1977
26.49
+0.834
3.25%
jan 1, 1978
27.315
+0.825
3.12%
jan 1, 1979
28.835
+1.52
5.57%
jan 1, 1982
33.497
+4.662
16.17%
jan 1, 1983
35.885
+2.387
7.13%
jan 1, 1984
39.095
+3.21
8.95%
jan 1, 1985
39.421
+0.326
0.83%
jan 1, 1989
54.565
+15.145
38.42%
jan 1, 1990
53.912
-0.654
-1.2%
jan 1, 1991
50.594
-3.318
-6.15%
jan 1, 1992
48.933
-1.661
-3.28%
jan 1, 1993
48.024
-0.909
-1.86%
jan 1, 1994
48.153
+0.129
0.27%
jan 1, 1995
48.37
+0.217
0.45%
jan 1, 1996
51.205
+2.835
5.86%
jan 1, 1997
54.008
+2.803
5.47%
jan 1, 2000
55.698
+1.69
3.13%
jan 1, 2001
55.975
+0.277
0.5%
jan 1, 2002
56.064
+0.089
0.16%
jan 1, 2003
57.539
+1.475
2.63%
jan 1, 2004
60.562
+3.023
5.25%
jan 1, 2005
62.126
+1.564
2.58%
jan 1, 2006
60.44
-1.686
-2.71%
jan 1, 2007
62.343
+1.903
3.15%
jan 1, 2008
70.354
+8.011
12.85%
jan 1, 2009
70.013
-0.342
-0.49%
jan 1, 2010
74.984
+4.971
7.1%
jan 1, 2011
76.301
+1.318
1.76%
jan 1, 2012
79.007
+2.706
3.55%
jan 1, 2013
79.354
+0.347
0.44%
jan 1, 2014
83.709
+4.355
5.49%
jan 1, 2015
82.761
-0.949
-1.13%
Ranking of countries by current statistics by years


Comments: