29
/
en
AIzaSyAYiBZKx7MnpbEhh9jyipgxe19OcubqV5w
April 1, 2024
54421
Pacific island small states
PSS
false
2
1
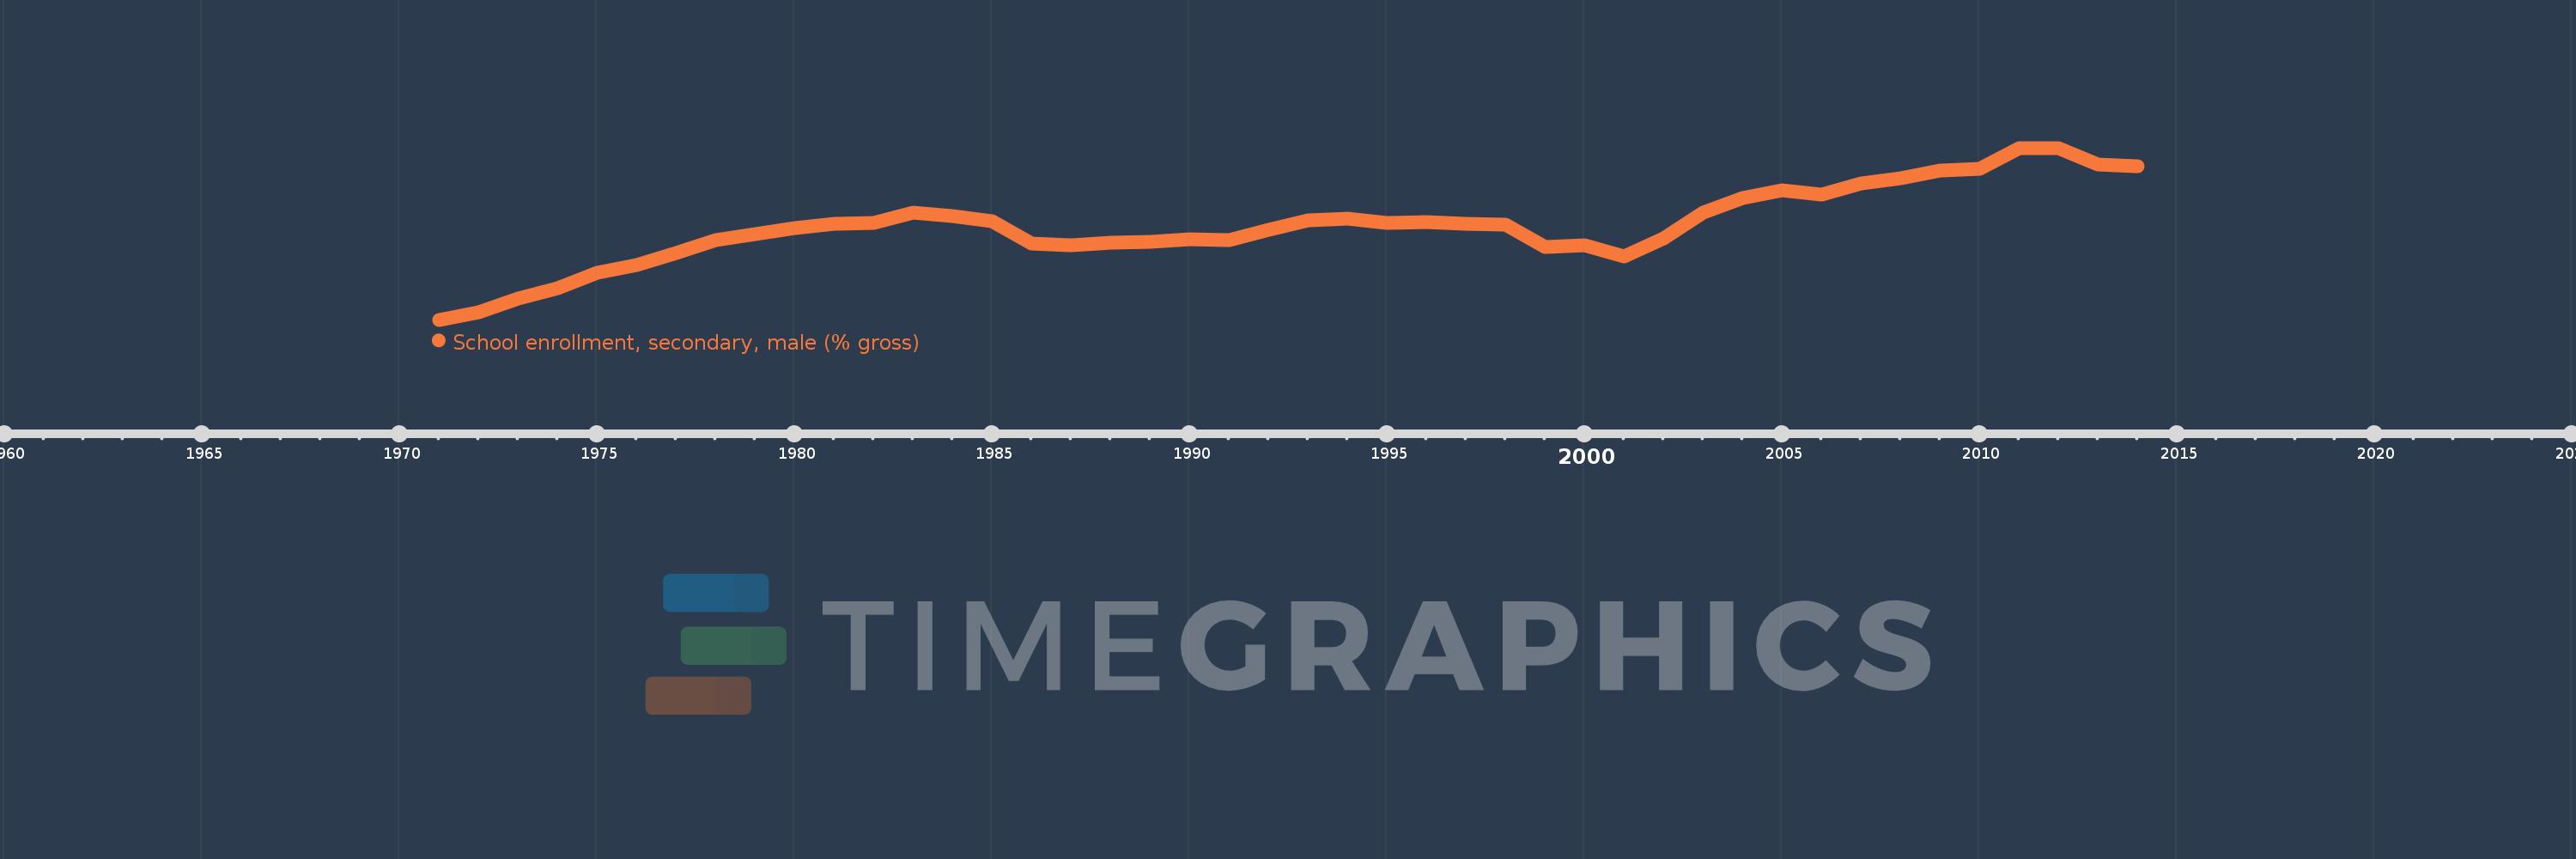
School enrollment, secondary, male (% gross)
2014,2013,2012,2011,2010,2009,2008,2007,2006,2005,2004,2003,2002,2001,2000,1999,1998,1997,1996,1995,1994,1993,1992,1991,1990,1989,1988,1987,1986,1985,1984,1983,1982,1981,1980,1979,1978,1977,1976,1975,1974,1973,1972,1971
This statistics in other country:
AfghanistanAlbaniaAlgeriaAndorraAngolaAntigua and BarbudaArab WorldArgentinaArmeniaArubaAustraliaAustriaAzerbaijanBahamas, TheBahrainBangladeshBarbadosBelarusBelgiumBelizeBeninBermudaBhutanBoliviaBosnia and HerzegovinaBotswanaBrazilBrunei DarussalamBulgariaBurkina FasoBurundiCabo VerdeCambodiaCameroonCanadaCaribbean small statesCentral African RepublicCentral Europe and the BalticsChadChileChinaColombiaComorosCongo, Dem. Rep.Congo, Rep.Costa RicaCote d'IvoireCroatiaCubaCuracaoCyprusCzech RepublicDenmarkDjiboutiDominicaDominican RepublicEarly-demographic dividendEast Asia & PacificEast Asia & Pacific (excluding high income)East Asia & Pacific (IDA & IBRD countries)EcuadorEgypt, Arab Rep.El SalvadorEquatorial GuineaEritreaEstoniaEthiopiaEuro areaEurope & Central AsiaEurope & Central Asia (excluding high income)Europe & Central Asia (IDA & IBRD countries)European UnionFijiFinlandFragile and conflict affected situationsFranceGabonGambia, TheGeorgiaGermanyGhanaGreeceGrenadaGuatemalaGuineaGuinea-BissauGuyanaHeavily indebted poor countries (HIPC)High incomeHondurasHong Kong SAR, ChinaHungaryIBRD onlyIcelandIDA & IBRD totalIDA blendIDA onlyIDA totalIndiaIndonesiaIran, Islamic Rep.IraqIrelandIsraelItalyJamaicaJapanJordanKazakhstanKenyaKiribatiKorea, Dem. People’s Rep.Korea, Rep.KuwaitKyrgyz RepublicLao PDRLate-demographic dividendLatin America & Caribbean Latin America & Caribbean (excluding high income)Latin America & the Caribbean (IDA & IBRD countries)LatviaLeast developed countries: UN classificationLebanonLesothoLiberiaLibyaLiechtensteinLithuaniaLow & middle incomeLow incomeLower middle incomeLuxembourgMacao SAR, ChinaMacedonia, FYRMadagascarMalawiMaldivesMaliMaltaMarshall IslandsMauritaniaMauritiusMexicoMicronesia, Fed. Sts.Middle East & North AfricaMiddle East & North Africa (excluding high income)Middle East & North Africa (IDA & IBRD countries)Middle incomeMoldovaMongoliaMontenegroMoroccoMozambiqueMyanmarNamibiaNauruNepalNetherlandsNew ZealandNicaraguaNigerNigeriaNorth AmericaNorwayOECD membersOmanOther small statesPacific island small statesPakistanPalauPanamaPapua New GuineaParaguayPeruPhilippinesPolandPortugalPost-demographic dividendPre-demographic dividendPuerto RicoQatarRomaniaRussian FederationRwandaSamoaSan MarinoSao Tome and PrincipeSaudi ArabiaSenegalSerbiaSeychellesSierra LeoneSlovak RepublicSloveniaSmall statesSolomon IslandsSomaliaSouth AfricaSouth AsiaSouth Asia (IDA & IBRD)SpainSri LankaSt. Kitts and NevisSt. LuciaSt. Vincent and the GrenadinesSub-Saharan Africa Sub-Saharan Africa (excluding high income)Sub-Saharan Africa (IDA & IBRD countries)SudanSurinameSwazilandSwedenSwitzerlandSyrian Arab RepublicTajikistanTanzaniaThailandTimor-LesteTogoTongaTrinidad and TobagoTunisiaTurkeyTurkmenistanTuvaluUgandaUkraineUnited Arab EmiratesUnited KingdomUnited StatesUpper middle incomeUruguayUzbekistanVanuatuVenezuela, RBVietnamWest Bank and GazaWorldYemen, Rep.ZambiaZimbabwe Timeline:
This timeline shows a graph from 1971 to 2014 of Pacific island small states. No data until 1970. Number of actual observations by date: 44.
Source name:
World Development Indicators
Source organization:
United Nations Educational, Scientific, and Cultural Organization (UNESCO) Institute for Statistics.
Categories, topics:
Education, Gender
Last updated:
apr 23, 2017
Indicators value changes by year
Minimum:
52.894
jan 1, 1971
At the date of observation
Value
Absolute change
Change from previous value
jan 1, 1971
52.894
+52.894
0.0%
jan 1, 1972
53.798
+0.903
1.71%
jan 1, 1973
55.538
+1.741
3.24%
jan 1, 1974
56.802
+1.264
2.28%
jan 1, 1975
58.726
+1.924
3.39%
jan 1, 1976
59.771
+1.044
1.78%
jan 1, 1977
61.278
+1.508
2.52%
jan 1, 1978
62.872
+1.593
2.6%
jan 1, 1979
63.578
+0.706
1.12%
jan 1, 1980
64.386
+0.808
1.27%
jan 1, 1981
64.896
+0.509
0.79%
jan 1, 1982
64.99
+0.095
0.15%
jan 1, 1983
66.238
+1.247
1.92%
jan 1, 1984
65.85
-0.388
-0.59%
jan 1, 1985
65.21
-0.64
-0.97%
jan 1, 1986
62.452
-2.758
-4.23%
jan 1, 1987
62.184
-0.268
-0.43%
jan 1, 1988
62.547
+0.363
0.58%
jan 1, 1989
62.637
+0.09
0.14%
jan 1, 1990
62.888
+0.251
0.4%
jan 1, 1991
62.878
-0.01
-0.02%
jan 1, 1992
64.137
+1.259
2.0%
jan 1, 1993
65.32
+1.183
1.84%
jan 1, 1994
65.478
+0.158
0.24%
jan 1, 1995
65.006
-0.472
-0.72%
jan 1, 1996
65.066
+0.06
0.09%
jan 1, 1997
64.829
-0.237
-0.36%
jan 1, 1998
64.725
-0.105
-0.16%
jan 1, 1999
61.947
-2.777
-4.29%
jan 1, 2000
62.202
+0.255
0.41%
jan 1, 2001
60.754
-1.449
-2.33%
jan 1, 2002
63.037
+2.283
3.76%
jan 1, 2003
66.273
+3.236
5.13%
jan 1, 2004
68.103
+1.83
2.76%
jan 1, 2005
69.01
+0.908
1.33%
jan 1, 2006
68.519
-0.491
-0.71%
jan 1, 2007
69.956
+1.437
2.1%
jan 1, 2008
70.507
+0.551
0.79%
jan 1, 2009
71.47
+0.963
1.37%
jan 1, 2010
71.782
+0.312
0.44%
jan 1, 2011
74.34
+2.558
3.56%
jan 1, 2012
74.33
-0.01
-0.01%
jan 1, 2013
72.307
-2.023
-2.72%
jan 1, 2014
72.066
-0.242
-0.33%
Ranking of countries by current statistics by years


Comments: