29
/
en
AIzaSyAYiBZKx7MnpbEhh9jyipgxe19OcubqV5w
April 1, 2024
38573
IDA blend
IDB
false
2
1
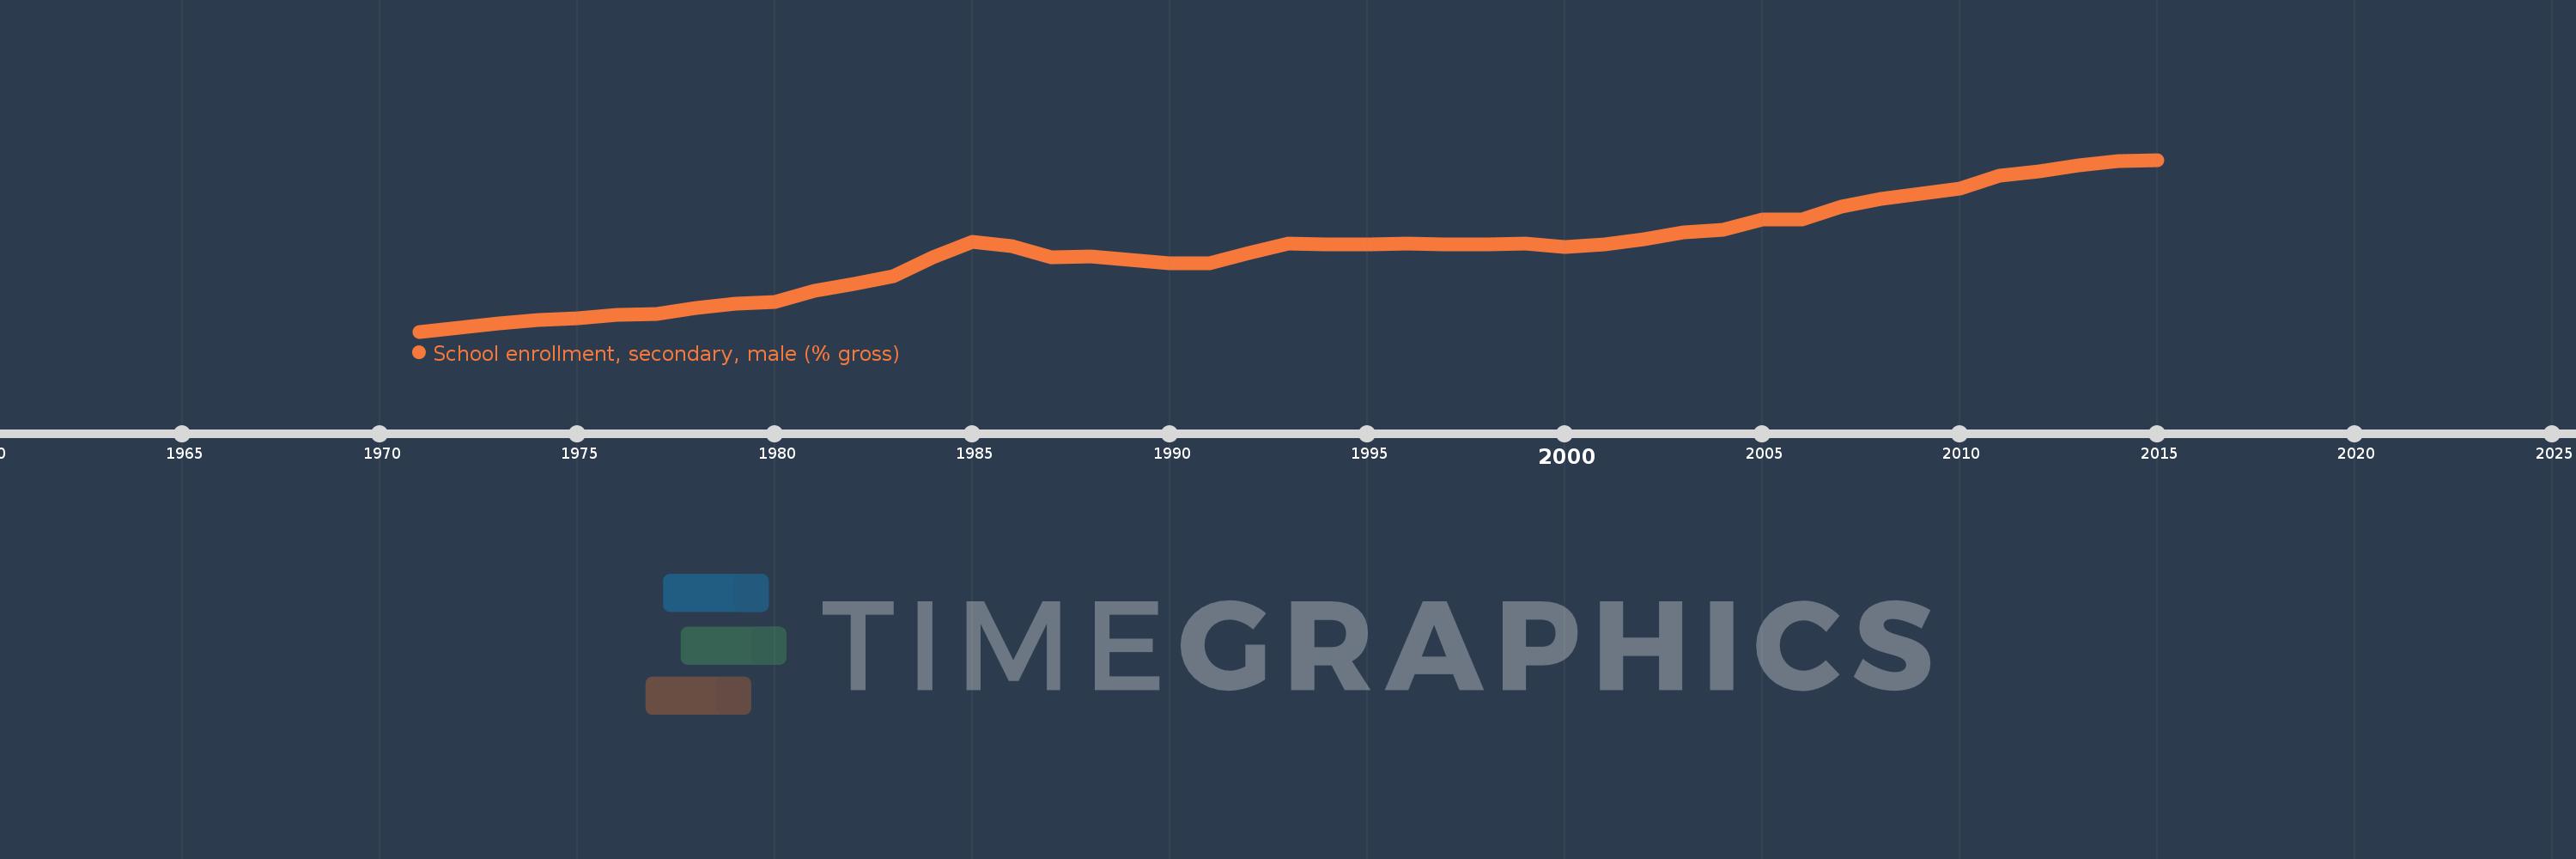
School enrollment, secondary, male (% gross)
2015,2014,2013,2012,2011,2010,2009,2008,2007,2006,2005,2004,2003,2002,2001,2000,1999,1998,1997,1996,1995,1994,1993,1992,1991,1990,1989,1988,1987,1986,1985,1984,1983,1982,1981,1980,1979,1978,1977,1976,1975,1974,1973,1972,1971
This statistics in other country:
AfghanistanAlbaniaAlgeriaAndorraAngolaAntigua and BarbudaArab WorldArgentinaArmeniaArubaAustraliaAustriaAzerbaijanBahamas, TheBahrainBangladeshBarbadosBelarusBelgiumBelizeBeninBermudaBhutanBoliviaBosnia and HerzegovinaBotswanaBrazilBrunei DarussalamBulgariaBurkina FasoBurundiCabo VerdeCambodiaCameroonCanadaCaribbean small statesCentral African RepublicCentral Europe and the BalticsChadChileChinaColombiaComorosCongo, Dem. Rep.Congo, Rep.Costa RicaCote d'IvoireCroatiaCubaCuracaoCyprusCzech RepublicDenmarkDjiboutiDominicaDominican RepublicEarly-demographic dividendEast Asia & PacificEast Asia & Pacific (excluding high income)East Asia & Pacific (IDA & IBRD countries)EcuadorEgypt, Arab Rep.El SalvadorEquatorial GuineaEritreaEstoniaEthiopiaEuro areaEurope & Central AsiaEurope & Central Asia (excluding high income)Europe & Central Asia (IDA & IBRD countries)European UnionFijiFinlandFragile and conflict affected situationsFranceGabonGambia, TheGeorgiaGermanyGhanaGreeceGrenadaGuatemalaGuineaGuinea-BissauGuyanaHeavily indebted poor countries (HIPC)High incomeHondurasHong Kong SAR, ChinaHungaryIBRD onlyIcelandIDA & IBRD totalIDA blendIDA onlyIDA totalIndiaIndonesiaIran, Islamic Rep.IraqIrelandIsraelItalyJamaicaJapanJordanKazakhstanKenyaKiribatiKorea, Dem. People’s Rep.Korea, Rep.KuwaitKyrgyz RepublicLao PDRLate-demographic dividendLatin America & Caribbean Latin America & Caribbean (excluding high income)Latin America & the Caribbean (IDA & IBRD countries)LatviaLeast developed countries: UN classificationLebanonLesothoLiberiaLibyaLiechtensteinLithuaniaLow & middle incomeLow incomeLower middle incomeLuxembourgMacao SAR, ChinaMacedonia, FYRMadagascarMalawiMaldivesMaliMaltaMarshall IslandsMauritaniaMauritiusMexicoMicronesia, Fed. Sts.Middle East & North AfricaMiddle East & North Africa (excluding high income)Middle East & North Africa (IDA & IBRD countries)Middle incomeMoldovaMongoliaMontenegroMoroccoMozambiqueMyanmarNamibiaNauruNepalNetherlandsNew ZealandNicaraguaNigerNigeriaNorth AmericaNorwayOECD membersOmanOther small statesPacific island small statesPakistanPalauPanamaPapua New GuineaParaguayPeruPhilippinesPolandPortugalPost-demographic dividendPre-demographic dividendPuerto RicoQatarRomaniaRussian FederationRwandaSamoaSan MarinoSao Tome and PrincipeSaudi ArabiaSenegalSerbiaSeychellesSierra LeoneSlovak RepublicSloveniaSmall statesSolomon IslandsSomaliaSouth AfricaSouth AsiaSouth Asia (IDA & IBRD)SpainSri LankaSt. Kitts and NevisSt. LuciaSt. Vincent and the GrenadinesSub-Saharan Africa Sub-Saharan Africa (excluding high income)Sub-Saharan Africa (IDA & IBRD countries)SudanSurinameSwazilandSwedenSwitzerlandSyrian Arab RepublicTajikistanTanzaniaThailandTimor-LesteTogoTongaTrinidad and TobagoTunisiaTurkeyTurkmenistanTuvaluUgandaUkraineUnited Arab EmiratesUnited KingdomUnited StatesUpper middle incomeUruguayUzbekistanVanuatuVenezuela, RBVietnamWest Bank and GazaWorldYemen, Rep.ZambiaZimbabwe Timeline:
This timeline shows a graph from 1971 to 2015 of IDA blend. No data until 1970. Number of actual observations by date: 45.
Source name:
World Development Indicators
Source organization:
United Nations Educational, Scientific, and Cultural Organization (UNESCO) Institute for Statistics.
Categories, topics:
Education, Gender
Last updated:
apr 23, 2017
Indicators value changes by year
Maximum:
54.454
jan 1, 2015
At the date of observation
Value
Absolute change
Change from previous value
jan 1, 1971
29.37
+29.37
0.0%
jan 1, 1972
29.91
+0.54
1.84%
jan 1, 1973
30.563
+0.653
2.18%
jan 1, 1974
31.019
+0.457
1.49%
jan 1, 1975
31.319
+0.3
0.97%
jan 1, 1976
31.803
+0.484
1.55%
jan 1, 1977
31.945
+0.142
0.45%
jan 1, 1978
32.767
+0.822
2.57%
jan 1, 1979
33.508
+0.741
2.26%
jan 1, 1980
33.72
+0.212
0.63%
jan 1, 1981
35.366
+1.645
4.88%
jan 1, 1982
36.348
+0.982
2.78%
jan 1, 1983
37.517
+1.169
3.22%
jan 1, 1984
40.207
+2.69
7.17%
jan 1, 1985
42.458
+2.25
5.6%
jan 1, 1986
41.808
-0.65
-1.53%
jan 1, 1987
40.221
-1.587
-3.8%
jan 1, 1988
40.341
+0.121
0.3%
jan 1, 1989
39.797
-0.544
-1.35%
jan 1, 1990
39.384
-0.413
-1.04%
jan 1, 1991
39.369
-0.015
-0.04%
jan 1, 1992
40.805
+1.436
3.65%
jan 1, 1993
42.248
+1.443
3.54%
jan 1, 1994
42.062
-0.186
-0.44%
jan 1, 1995
42.091
+0.028
0.07%
jan 1, 1996
42.168
+0.077
0.18%
jan 1, 1997
42.073
-0.094
-0.22%
jan 1, 1998
42.104
+0.031
0.07%
jan 1, 1999
42.212
+0.108
0.26%
jan 1, 2000
41.759
-0.453
-1.07%
jan 1, 2001
42.083
+0.325
0.78%
jan 1, 2002
42.914
+0.83
1.97%
jan 1, 2003
43.827
+0.913
2.13%
jan 1, 2004
44.256
+0.429
0.98%
jan 1, 2005
45.763
+1.507
3.41%
jan 1, 2006
45.758
-0.006
-0.01%
jan 1, 2007
47.662
+1.904
4.16%
jan 1, 2008
48.696
+1.034
2.17%
jan 1, 2009
49.549
+0.853
1.75%
jan 1, 2010
50.311
+0.762
1.54%
jan 1, 2011
52.17
+1.859
3.7%
jan 1, 2012
52.8
+0.63
1.21%
jan 1, 2013
53.578
+0.778
1.47%
jan 1, 2014
54.209
+0.632
1.18%
jan 1, 2015
54.454
+0.244
0.45%
Ranking of countries by current statistics by years


Comments: