29
/
en
AIzaSyAYiBZKx7MnpbEhh9jyipgxe19OcubqV5w
April 1, 2024
152007
Hong Kong SAR, China
HKG
true
2
1
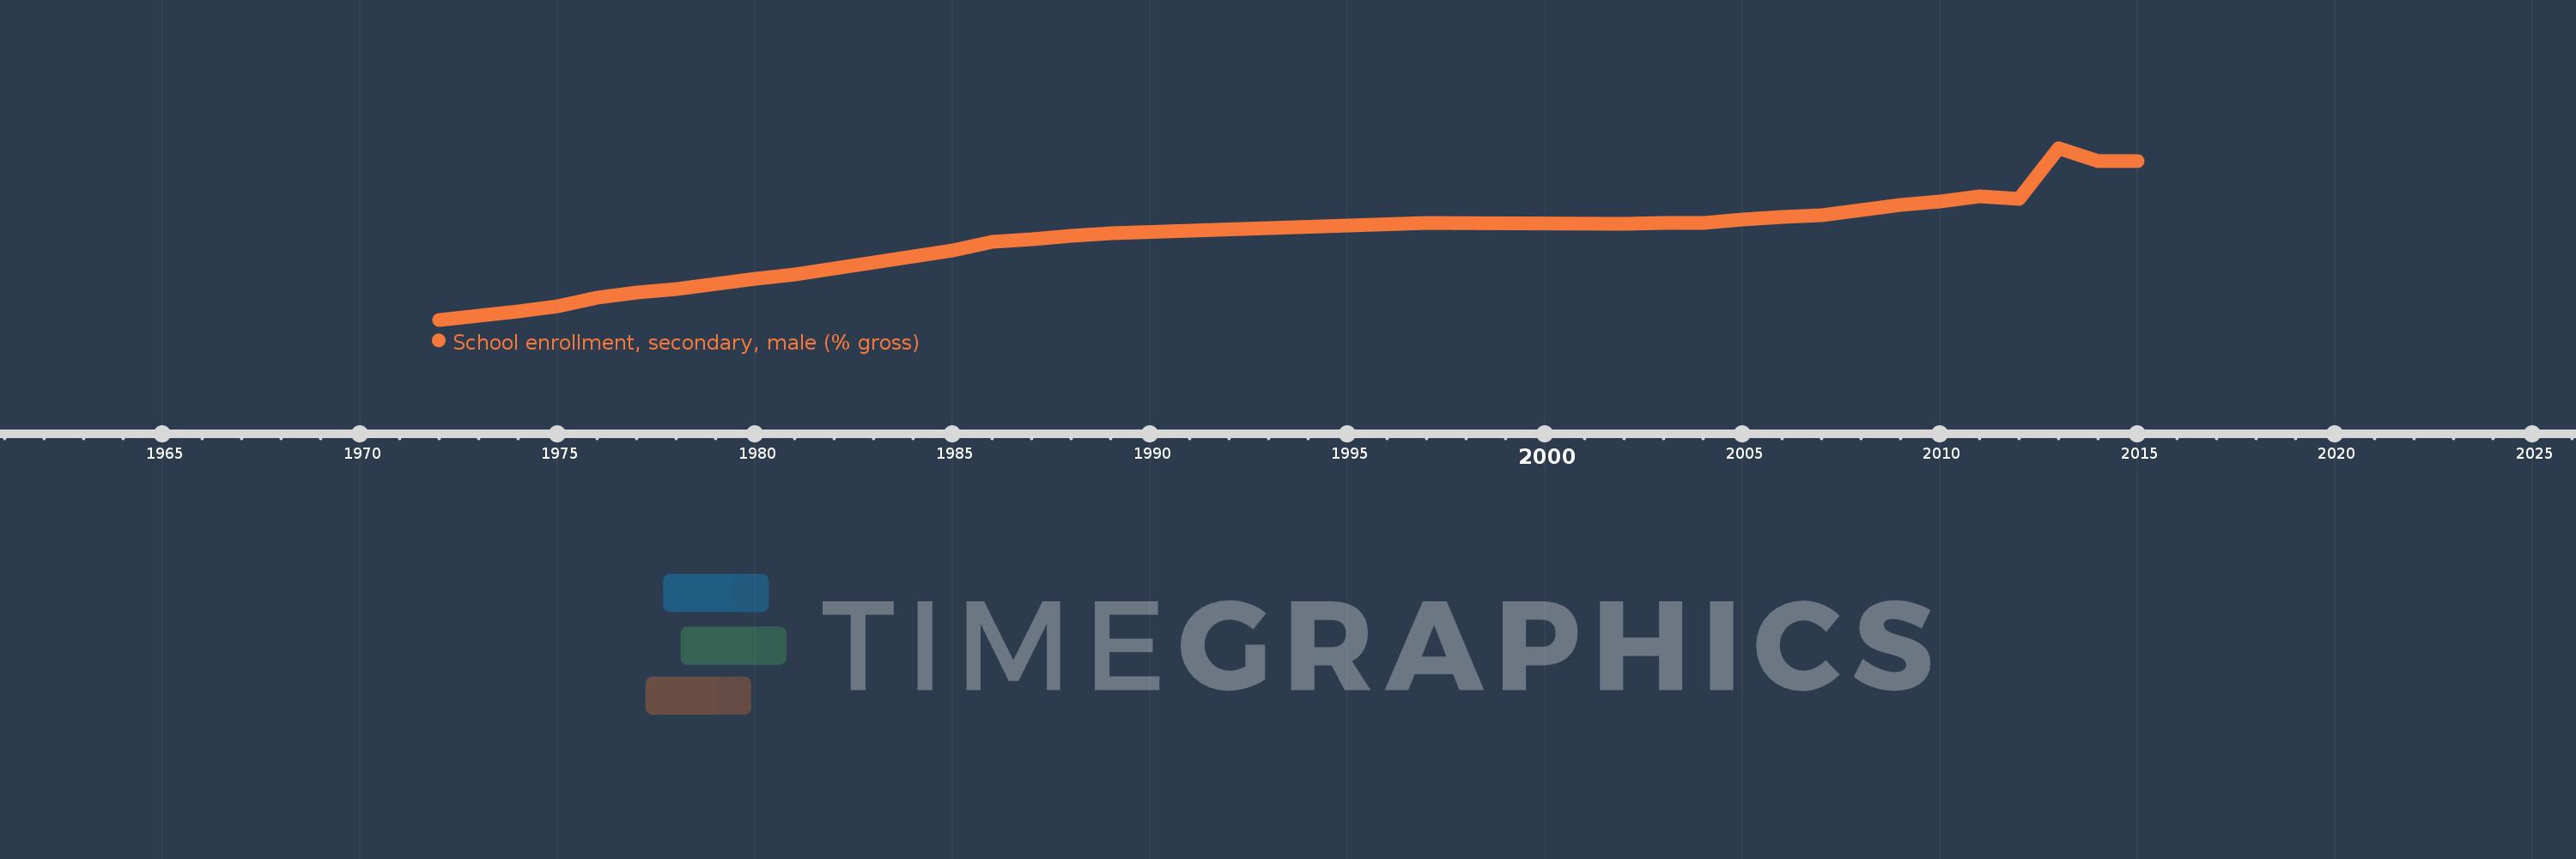
School enrollment, secondary, male (% gross)
2015,2014,2013,2012,2011,2010,2009,2008,2007,2006,2005,2004,2003,2002,1997,1989,1988,1987,1986,1985,1984,1983,1982,1981,1980,1979,1978,1977,1976,1975,1974,1973,1972
This statistics in other country:
AfghanistanAlbaniaAlgeriaAndorraAngolaAntigua and BarbudaArab WorldArgentinaArmeniaArubaAustraliaAustriaAzerbaijanBahamas, TheBahrainBangladeshBarbadosBelarusBelgiumBelizeBeninBermudaBhutanBoliviaBosnia and HerzegovinaBotswanaBrazilBrunei DarussalamBulgariaBurkina FasoBurundiCabo VerdeCambodiaCameroonCanadaCaribbean small statesCentral African RepublicCentral Europe and the BalticsChadChileChinaColombiaComorosCongo, Dem. Rep.Congo, Rep.Costa RicaCote d'IvoireCroatiaCubaCuracaoCyprusCzech RepublicDenmarkDjiboutiDominicaDominican RepublicEarly-demographic dividendEast Asia & PacificEast Asia & Pacific (excluding high income)East Asia & Pacific (IDA & IBRD countries)EcuadorEgypt, Arab Rep.El SalvadorEquatorial GuineaEritreaEstoniaEthiopiaEuro areaEurope & Central AsiaEurope & Central Asia (excluding high income)Europe & Central Asia (IDA & IBRD countries)European UnionFijiFinlandFragile and conflict affected situationsFranceGabonGambia, TheGeorgiaGermanyGhanaGreeceGrenadaGuatemalaGuineaGuinea-BissauGuyanaHeavily indebted poor countries (HIPC)High incomeHondurasHong Kong SAR, ChinaHungaryIBRD onlyIcelandIDA & IBRD totalIDA blendIDA onlyIDA totalIndiaIndonesiaIran, Islamic Rep.IraqIrelandIsraelItalyJamaicaJapanJordanKazakhstanKenyaKiribatiKorea, Dem. People’s Rep.Korea, Rep.KuwaitKyrgyz RepublicLao PDRLate-demographic dividendLatin America & Caribbean Latin America & Caribbean (excluding high income)Latin America & the Caribbean (IDA & IBRD countries)LatviaLeast developed countries: UN classificationLebanonLesothoLiberiaLibyaLiechtensteinLithuaniaLow & middle incomeLow incomeLower middle incomeLuxembourgMacao SAR, ChinaMacedonia, FYRMadagascarMalawiMaldivesMaliMaltaMarshall IslandsMauritaniaMauritiusMexicoMicronesia, Fed. Sts.Middle East & North AfricaMiddle East & North Africa (excluding high income)Middle East & North Africa (IDA & IBRD countries)Middle incomeMoldovaMongoliaMontenegroMoroccoMozambiqueMyanmarNamibiaNauruNepalNetherlandsNew ZealandNicaraguaNigerNigeriaNorth AmericaNorwayOECD membersOmanOther small statesPacific island small statesPakistanPalauPanamaPapua New GuineaParaguayPeruPhilippinesPolandPortugalPost-demographic dividendPre-demographic dividendPuerto RicoQatarRomaniaRussian FederationRwandaSamoaSan MarinoSao Tome and PrincipeSaudi ArabiaSenegalSerbiaSeychellesSierra LeoneSlovak RepublicSloveniaSmall statesSolomon IslandsSomaliaSouth AfricaSouth AsiaSouth Asia (IDA & IBRD)SpainSri LankaSt. Kitts and NevisSt. LuciaSt. Vincent and the GrenadinesSub-Saharan Africa Sub-Saharan Africa (excluding high income)Sub-Saharan Africa (IDA & IBRD countries)SudanSurinameSwazilandSwedenSwitzerlandSyrian Arab RepublicTajikistanTanzaniaThailandTimor-LesteTogoTongaTrinidad and TobagoTunisiaTurkeyTurkmenistanTuvaluUgandaUkraineUnited Arab EmiratesUnited KingdomUnited StatesUpper middle incomeUruguayUzbekistanVanuatuVenezuela, RBVietnamWest Bank and GazaWorldYemen, Rep.ZambiaZimbabwe Timeline:
This timeline shows a graph from 1972 to 2015 of Hong Kong SAR, China. No data until 1971. Number of actual observations by date: 33.
Source name:
World Development Indicators
Source organization:
United Nations Educational, Scientific, and Cultural Organization (UNESCO) Institute for Statistics.
Categories, topics:
Education, Gender
Last updated:
apr 23, 2017
Indicators value changes by year
Minimum:
39.716
jan 1, 1972
Maximum:
107.637
jan 1, 2013
At the date of observation
Value
Absolute change
Change from previous value
jan 1, 1972
39.716
+39.716
0.0%
jan 1, 1973
41.299
+1.583
3.99%
jan 1, 1974
42.925
+1.626
3.94%
jan 1, 1975
44.932
+2.007
4.68%
jan 1, 1976
48.459
+3.527
7.85%
jan 1, 1977
50.463
+2.004
4.13%
jan 1, 1978
51.974
+1.511
2.99%
jan 1, 1979
53.732
+1.759
3.38%
jan 1, 1980
55.97
+2.238
4.17%
jan 1, 1981
57.595
+1.625
2.9%
jan 1, 1982
59.835
+2.239
3.89%
jan 1, 1983
62.357
+2.523
4.22%
jan 1, 1984
64.71
+2.353
3.77%
jan 1, 1985
67.215
+2.505
3.87%
jan 1, 1986
70.383
+3.168
4.71%
jan 1, 1987
71.465
+1.082
1.54%
jan 1, 1988
72.924
+1.459
2.04%
jan 1, 1989
73.878
+0.954
1.31%
jan 1, 1997
78.137
+4.259
5.77%
jan 1, 2002
77.637
-0.5
-0.64%
jan 1, 2003
77.892
+0.255
0.33%
jan 1, 2004
77.986
+0.095
0.12%
jan 1, 2005
79.374
+1.388
1.78%
jan 1, 2006
80.491
+1.117
1.41%
jan 1, 2007
80.951
+0.46
0.57%
jan 1, 2008
83.173
+2.222
2.75%
jan 1, 2009
84.98
+1.807
2.17%
jan 1, 2010
86.419
+1.439
1.69%
jan 1, 2011
88.403
+1.984
2.3%
jan 1, 2012
87.52
-0.883
-1.0%
jan 1, 2013
107.637
+20.117
22.99%
jan 1, 2014
102.484
-5.152
-4.79%
jan 1, 2015
102.535
+0.051
0.05%
Ranking of countries by current statistics by years


Comments: