29
/
en
AIzaSyAYiBZKx7MnpbEhh9jyipgxe19OcubqV5w
April 1, 2024
165527
Jordan
JOR
true
2
1
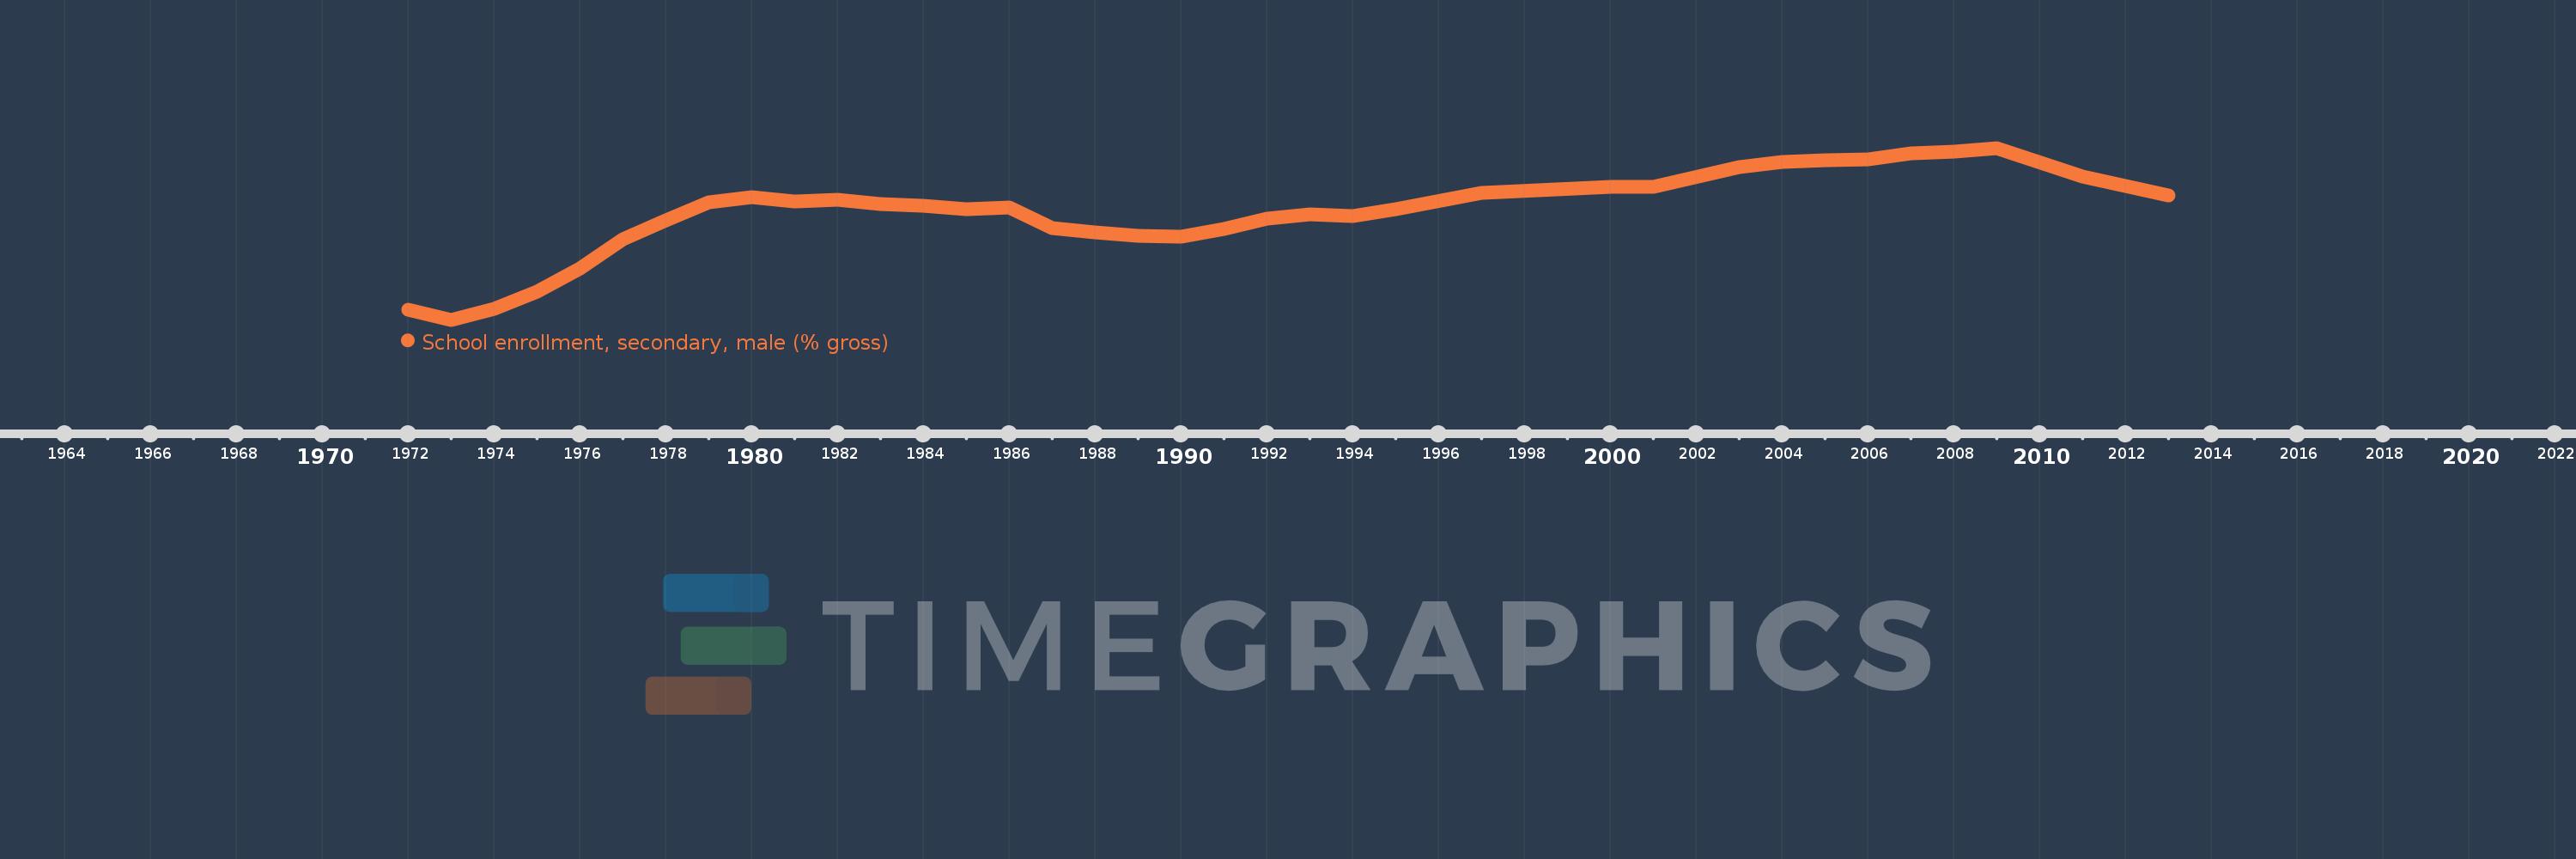
School enrollment, secondary, male (% gross)
2013,2012,2011,2009,2008,2007,2006,2005,2004,2003,2001,2000,1997,1995,1994,1993,1992,1991,1990,1989,1988,1987,1986,1985,1984,1983,1982,1981,1980,1979,1978,1977,1976,1975,1974,1973,1972
This statistics in other country:
AfghanistanAlbaniaAlgeriaAndorraAngolaAntigua and BarbudaArab WorldArgentinaArmeniaArubaAustraliaAustriaAzerbaijanBahamas, TheBahrainBangladeshBarbadosBelarusBelgiumBelizeBeninBermudaBhutanBoliviaBosnia and HerzegovinaBotswanaBrazilBrunei DarussalamBulgariaBurkina FasoBurundiCabo VerdeCambodiaCameroonCanadaCaribbean small statesCentral African RepublicCentral Europe and the BalticsChadChileChinaColombiaComorosCongo, Dem. Rep.Congo, Rep.Costa RicaCote d'IvoireCroatiaCubaCuracaoCyprusCzech RepublicDenmarkDjiboutiDominicaDominican RepublicEarly-demographic dividendEast Asia & PacificEast Asia & Pacific (excluding high income)East Asia & Pacific (IDA & IBRD countries)EcuadorEgypt, Arab Rep.El SalvadorEquatorial GuineaEritreaEstoniaEthiopiaEuro areaEurope & Central AsiaEurope & Central Asia (excluding high income)Europe & Central Asia (IDA & IBRD countries)European UnionFijiFinlandFragile and conflict affected situationsFranceGabonGambia, TheGeorgiaGermanyGhanaGreeceGrenadaGuatemalaGuineaGuinea-BissauGuyanaHeavily indebted poor countries (HIPC)High incomeHondurasHong Kong SAR, ChinaHungaryIBRD onlyIcelandIDA & IBRD totalIDA blendIDA onlyIDA totalIndiaIndonesiaIran, Islamic Rep.IraqIrelandIsraelItalyJamaicaJapanJordanKazakhstanKenyaKiribatiKorea, Dem. People’s Rep.Korea, Rep.KuwaitKyrgyz RepublicLao PDRLate-demographic dividendLatin America & Caribbean Latin America & Caribbean (excluding high income)Latin America & the Caribbean (IDA & IBRD countries)LatviaLeast developed countries: UN classificationLebanonLesothoLiberiaLibyaLiechtensteinLithuaniaLow & middle incomeLow incomeLower middle incomeLuxembourgMacao SAR, ChinaMacedonia, FYRMadagascarMalawiMaldivesMaliMaltaMarshall IslandsMauritaniaMauritiusMexicoMicronesia, Fed. Sts.Middle East & North AfricaMiddle East & North Africa (excluding high income)Middle East & North Africa (IDA & IBRD countries)Middle incomeMoldovaMongoliaMontenegroMoroccoMozambiqueMyanmarNamibiaNauruNepalNetherlandsNew ZealandNicaraguaNigerNigeriaNorth AmericaNorwayOECD membersOmanOther small statesPacific island small statesPakistanPalauPanamaPapua New GuineaParaguayPeruPhilippinesPolandPortugalPost-demographic dividendPre-demographic dividendPuerto RicoQatarRomaniaRussian FederationRwandaSamoaSan MarinoSao Tome and PrincipeSaudi ArabiaSenegalSerbiaSeychellesSierra LeoneSlovak RepublicSloveniaSmall statesSolomon IslandsSomaliaSouth AfricaSouth AsiaSouth Asia (IDA & IBRD)SpainSri LankaSt. Kitts and NevisSt. LuciaSt. Vincent and the GrenadinesSub-Saharan Africa Sub-Saharan Africa (excluding high income)Sub-Saharan Africa (IDA & IBRD countries)SudanSurinameSwazilandSwedenSwitzerlandSyrian Arab RepublicTajikistanTanzaniaThailandTimor-LesteTogoTongaTrinidad and TobagoTunisiaTurkeyTurkmenistanTuvaluUgandaUkraineUnited Arab EmiratesUnited KingdomUnited StatesUpper middle incomeUruguayUzbekistanVanuatuVenezuela, RBVietnamWest Bank and GazaWorldYemen, Rep.ZambiaZimbabwe Timeline:
This timeline shows a graph from 1972 to 2013 of Jordan. No data until 1971. Number of actual observations by date: 37.
Source name:
World Development Indicators
Source organization:
United Nations Educational, Scientific, and Cultural Organization (UNESCO) Institute for Statistics.
Categories, topics:
Education, Gender
Last updated:
apr 23, 2017
Indicators value changes by year
Maximum:
92.032
jan 1, 2009
At the date of observation
Value
Absolute change
Change from previous value
jan 1, 1972
58.613
+58.613
0.0%
jan 1, 1973
56.62
-1.993
-3.4%
jan 1, 1974
58.943
+2.323
4.1%
jan 1, 1975
62.374
+3.431
5.82%
jan 1, 1976
67.102
+4.728
7.58%
jan 1, 1977
73.125
+6.024
8.98%
jan 1, 1978
77.064
+3.939
5.39%
jan 1, 1979
80.855
+3.791
4.92%
jan 1, 1980
81.804
+0.949
1.17%
jan 1, 1981
81.023
-0.781
-0.96%
jan 1, 1982
81.351
+0.328
0.41%
jan 1, 1983
80.548
-0.803
-0.99%
jan 1, 1984
80.166
-0.383
-0.47%
jan 1, 1985
79.338
-0.827
-1.03%
jan 1, 1986
79.837
+0.498
0.63%
jan 1, 1987
75.571
-4.265
-5.34%
jan 1, 1988
74.542
-1.03
-1.36%
jan 1, 1989
73.837
-0.705
-0.95%
jan 1, 1990
73.795
-0.042
-0.06%
jan 1, 1991
75.293
+1.497
2.03%
jan 1, 1992
77.509
+2.216
2.94%
jan 1, 1993
78.289
+0.78
1.01%
jan 1, 1994
78.039
-0.25
-0.32%
jan 1, 1995
79.407
+1.368
1.75%
jan 1, 1997
82.718
+3.311
4.17%
jan 1, 2000
83.941
+1.222
1.48%
jan 1, 2001
84.07
+0.129
0.15%
jan 1, 2003
88.067
+3.997
4.75%
jan 1, 2004
89.23
+1.163
1.32%
jan 1, 2005
89.501
+0.271
0.3%
jan 1, 2006
89.697
+0.196
0.22%
jan 1, 2007
90.913
+1.216
1.36%
jan 1, 2008
91.304
+0.391
0.43%
jan 1, 2009
92.032
+0.728
0.8%
jan 1, 2011
86.099
-5.933
-6.45%
jan 1, 2012
84.185
-1.914
-2.22%
jan 1, 2013
82.267
-1.918
-2.28%
Ranking of countries by current statistics by years


Comments: