29
/
en
AIzaSyAYiBZKx7MnpbEhh9jyipgxe19OcubqV5w
April 1, 2024
41062
Late-demographic dividend
LTE
false
2
1
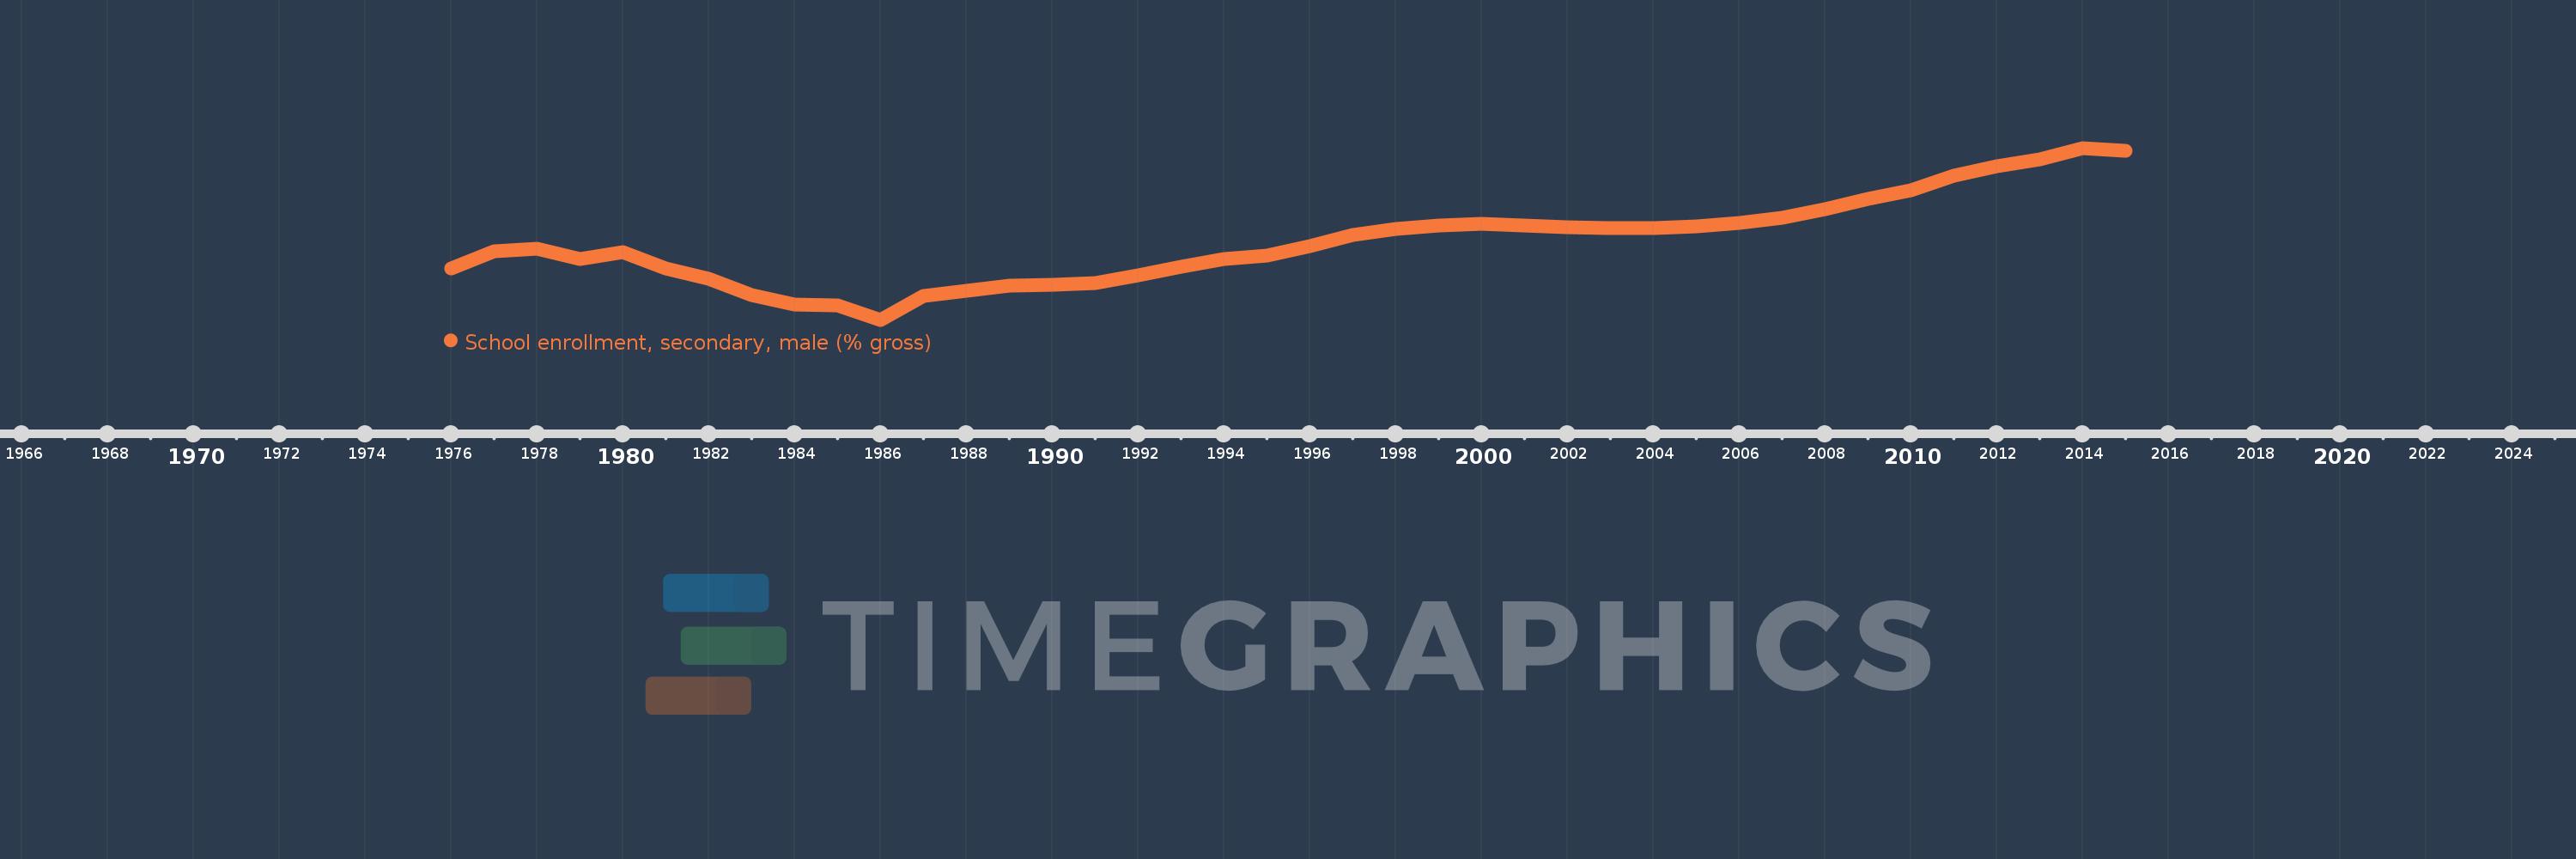
School enrollment, secondary, male (% gross)
2015,2014,2013,2012,2011,2010,2009,2008,2007,2006,2005,2004,2003,2002,2001,2000,1999,1998,1997,1996,1995,1994,1993,1992,1991,1990,1989,1988,1987,1986,1985,1984,1983,1982,1981,1980,1979,1978,1977,1976
This statistics in other country:
AfghanistanAlbaniaAlgeriaAndorraAngolaAntigua and BarbudaArab WorldArgentinaArmeniaArubaAustraliaAustriaAzerbaijanBahamas, TheBahrainBangladeshBarbadosBelarusBelgiumBelizeBeninBermudaBhutanBoliviaBosnia and HerzegovinaBotswanaBrazilBrunei DarussalamBulgariaBurkina FasoBurundiCabo VerdeCambodiaCameroonCanadaCaribbean small statesCentral African RepublicCentral Europe and the BalticsChadChileChinaColombiaComorosCongo, Dem. Rep.Congo, Rep.Costa RicaCote d'IvoireCroatiaCubaCuracaoCyprusCzech RepublicDenmarkDjiboutiDominicaDominican RepublicEarly-demographic dividendEast Asia & PacificEast Asia & Pacific (excluding high income)East Asia & Pacific (IDA & IBRD countries)EcuadorEgypt, Arab Rep.El SalvadorEquatorial GuineaEritreaEstoniaEthiopiaEuro areaEurope & Central AsiaEurope & Central Asia (excluding high income)Europe & Central Asia (IDA & IBRD countries)European UnionFijiFinlandFragile and conflict affected situationsFranceGabonGambia, TheGeorgiaGermanyGhanaGreeceGrenadaGuatemalaGuineaGuinea-BissauGuyanaHeavily indebted poor countries (HIPC)High incomeHondurasHong Kong SAR, ChinaHungaryIBRD onlyIcelandIDA & IBRD totalIDA blendIDA onlyIDA totalIndiaIndonesiaIran, Islamic Rep.IraqIrelandIsraelItalyJamaicaJapanJordanKazakhstanKenyaKiribatiKorea, Dem. People’s Rep.Korea, Rep.KuwaitKyrgyz RepublicLao PDRLate-demographic dividendLatin America & Caribbean Latin America & Caribbean (excluding high income)Latin America & the Caribbean (IDA & IBRD countries)LatviaLeast developed countries: UN classificationLebanonLesothoLiberiaLibyaLiechtensteinLithuaniaLow & middle incomeLow incomeLower middle incomeLuxembourgMacao SAR, ChinaMacedonia, FYRMadagascarMalawiMaldivesMaliMaltaMarshall IslandsMauritaniaMauritiusMexicoMicronesia, Fed. Sts.Middle East & North AfricaMiddle East & North Africa (excluding high income)Middle East & North Africa (IDA & IBRD countries)Middle incomeMoldovaMongoliaMontenegroMoroccoMozambiqueMyanmarNamibiaNauruNepalNetherlandsNew ZealandNicaraguaNigerNigeriaNorth AmericaNorwayOECD membersOmanOther small statesPacific island small statesPakistanPalauPanamaPapua New GuineaParaguayPeruPhilippinesPolandPortugalPost-demographic dividendPre-demographic dividendPuerto RicoQatarRomaniaRussian FederationRwandaSamoaSan MarinoSao Tome and PrincipeSaudi ArabiaSenegalSerbiaSeychellesSierra LeoneSlovak RepublicSloveniaSmall statesSolomon IslandsSomaliaSouth AfricaSouth AsiaSouth Asia (IDA & IBRD)SpainSri LankaSt. Kitts and NevisSt. LuciaSt. Vincent and the GrenadinesSub-Saharan Africa Sub-Saharan Africa (excluding high income)Sub-Saharan Africa (IDA & IBRD countries)SudanSurinameSwazilandSwedenSwitzerlandSyrian Arab RepublicTajikistanTanzaniaThailandTimor-LesteTogoTongaTrinidad and TobagoTunisiaTurkeyTurkmenistanTuvaluUgandaUkraineUnited Arab EmiratesUnited KingdomUnited StatesUpper middle incomeUruguayUzbekistanVanuatuVenezuela, RBVietnamWest Bank and GazaWorldYemen, Rep.ZambiaZimbabwe Timeline:
This timeline shows a graph from 1976 to 2015 of Late-demographic dividend. No data until 1975. Number of actual observations by date: 40.
Source name:
World Development Indicators
Source organization:
United Nations Educational, Scientific, and Cultural Organization (UNESCO) Institute for Statistics.
Categories, topics:
Education, Gender
Last updated:
apr 23, 2017
Indicators value changes by year
Minimum:
46.554
jan 1, 1986
Maximum:
92.943
jan 1, 2014
At the date of observation
Value
Absolute change
Change from previous value
jan 1, 1976
60.387
+60.387
0.0%
jan 1, 1977
65.085
+4.699
7.78%
jan 1, 1978
65.694
+0.609
0.94%
jan 1, 1979
62.917
-2.778
-4.23%
jan 1, 1980
64.913
+1.996
3.17%
jan 1, 1981
60.401
-4.512
-6.95%
jan 1, 1982
57.675
-2.725
-4.51%
jan 1, 1983
53.138
-4.537
-7.87%
jan 1, 1984
50.771
-2.367
-4.46%
jan 1, 1985
50.355
-0.416
-0.82%
jan 1, 1986
46.554
-3.801
-7.55%
jan 1, 1987
52.92
+6.366
13.67%
jan 1, 1988
54.366
+1.446
2.73%
jan 1, 1989
55.712
+1.346
2.48%
jan 1, 1990
56.002
+0.29
0.52%
jan 1, 1991
56.554
+0.552
0.99%
jan 1, 1992
58.458
+1.904
3.37%
jan 1, 1993
60.801
+2.343
4.01%
jan 1, 1994
62.98
+2.178
3.58%
jan 1, 1995
63.92
+0.94
1.49%
jan 1, 1996
66.401
+2.481
3.88%
jan 1, 1997
69.352
+2.952
4.45%
jan 1, 1998
71.163
+1.811
2.61%
jan 1, 1999
72.014
+0.85
1.2%
jan 1, 2000
72.394
+0.38
0.53%
jan 1, 2001
72.028
-0.366
-0.51%
jan 1, 2002
71.544
-0.484
-0.67%
jan 1, 2003
71.294
-0.25
-0.35%
jan 1, 2004
71.291
-0.003
0.0%
jan 1, 2005
71.834
+0.542
0.76%
jan 1, 2006
72.663
+0.83
1.15%
jan 1, 2007
74.065
+1.402
1.93%
jan 1, 2008
76.43
+2.365
3.19%
jan 1, 2009
79.105
+2.676
3.5%
jan 1, 2010
81.525
+2.42
3.06%
jan 1, 2011
85.429
+3.903
4.79%
jan 1, 2012
87.943
+2.514
2.94%
jan 1, 2013
89.818
+1.875
2.13%
jan 1, 2014
92.943
+3.125
3.48%
jan 1, 2015
92.074
-0.869
-0.93%
Ranking of countries by current statistics by years


Comments: