29
/
en
AIzaSyAYiBZKx7MnpbEhh9jyipgxe19OcubqV5w
April 1, 2024
90508
Botswana
BWA
true
2
1
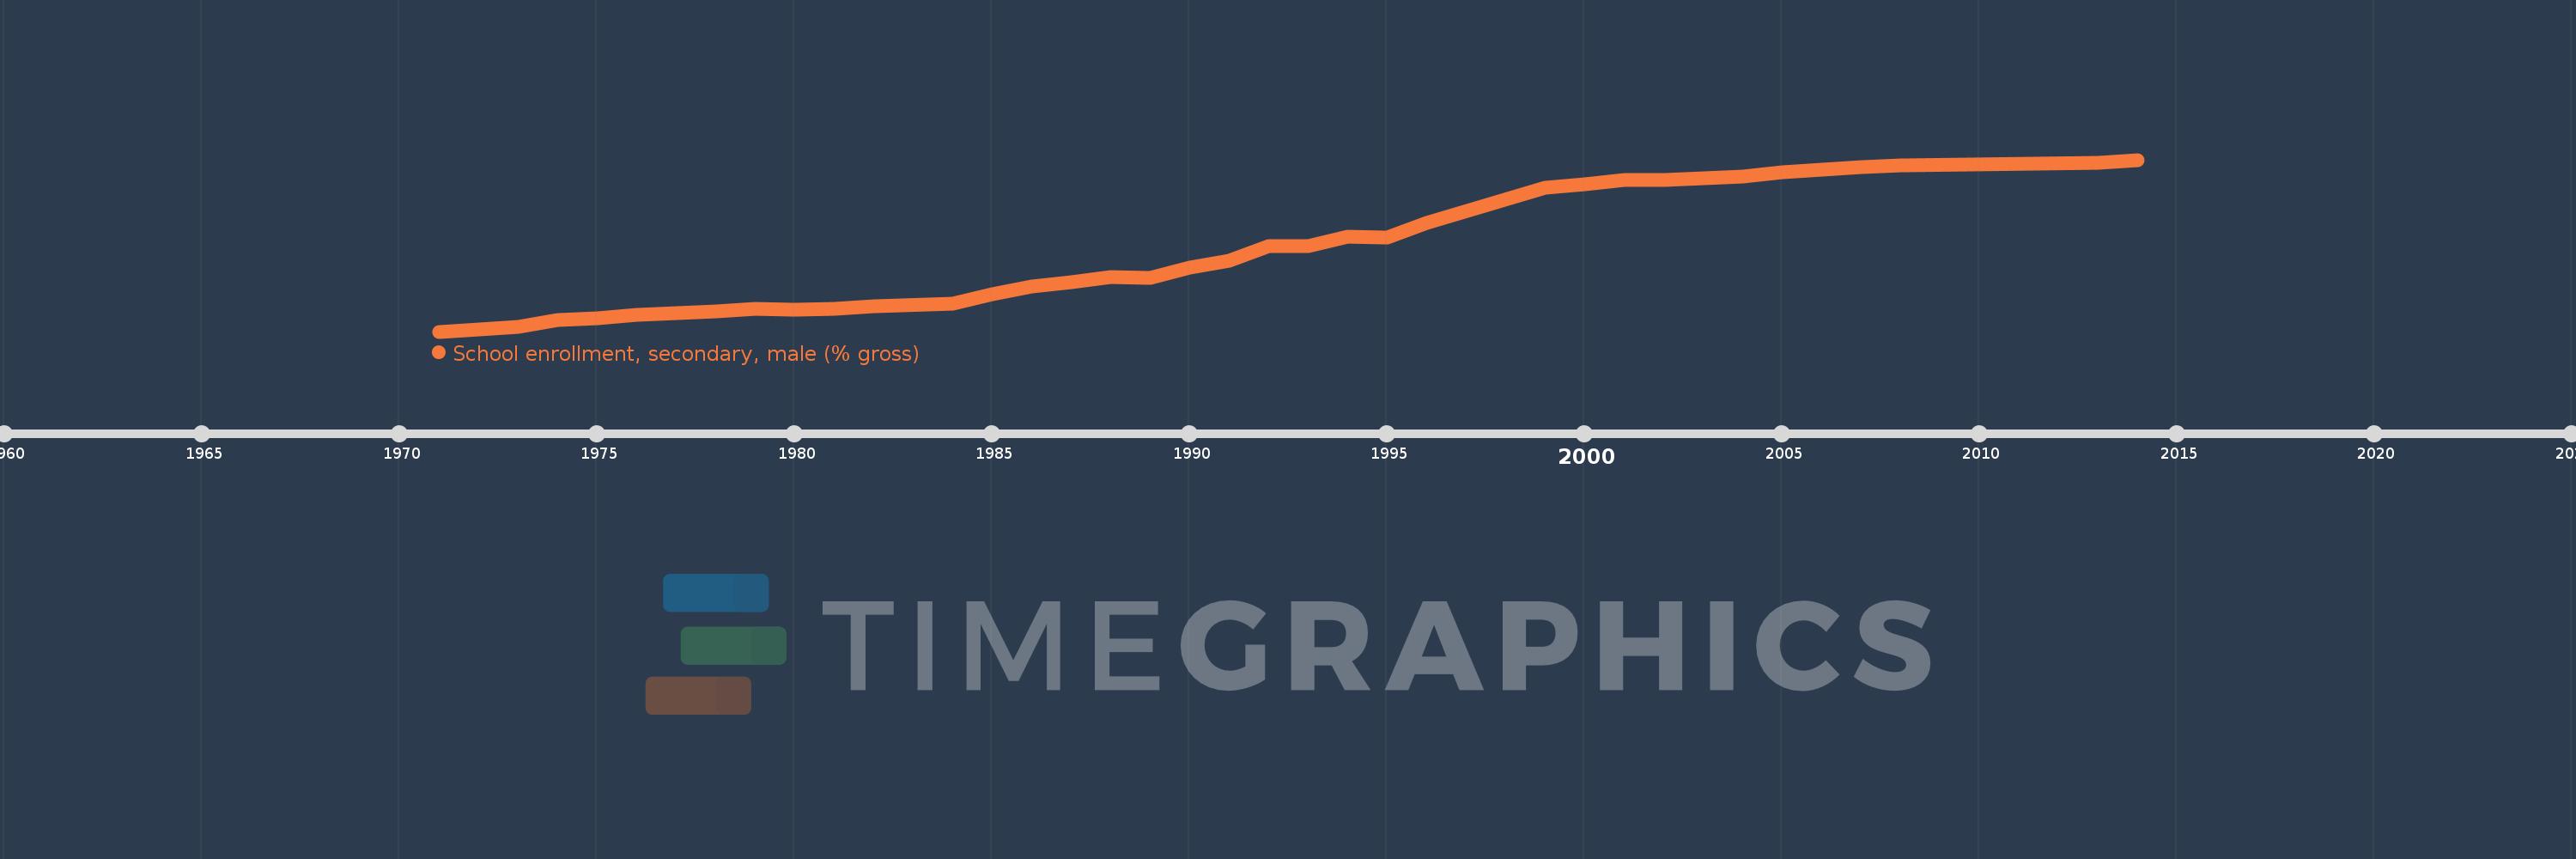
School enrollment, secondary, male (% gross)
2014,2013,2008,2007,2006,2005,2004,2003,2002,2001,2000,1999,1996,1995,1994,1993,1992,1991,1990,1989,1988,1987,1986,1985,1984,1982,1981,1980,1979,1978,1977,1976,1975,1974,1973,1972,1971
This statistics in other country:
AfghanistanAlbaniaAlgeriaAndorraAngolaAntigua and BarbudaArab WorldArgentinaArmeniaArubaAustraliaAustriaAzerbaijanBahamas, TheBahrainBangladeshBarbadosBelarusBelgiumBelizeBeninBermudaBhutanBoliviaBosnia and HerzegovinaBotswanaBrazilBrunei DarussalamBulgariaBurkina FasoBurundiCabo VerdeCambodiaCameroonCanadaCaribbean small statesCentral African RepublicCentral Europe and the BalticsChadChileChinaColombiaComorosCongo, Dem. Rep.Congo, Rep.Costa RicaCote d'IvoireCroatiaCubaCuracaoCyprusCzech RepublicDenmarkDjiboutiDominicaDominican RepublicEarly-demographic dividendEast Asia & PacificEast Asia & Pacific (excluding high income)East Asia & Pacific (IDA & IBRD countries)EcuadorEgypt, Arab Rep.El SalvadorEquatorial GuineaEritreaEstoniaEthiopiaEuro areaEurope & Central AsiaEurope & Central Asia (excluding high income)Europe & Central Asia (IDA & IBRD countries)European UnionFijiFinlandFragile and conflict affected situationsFranceGabonGambia, TheGeorgiaGermanyGhanaGreeceGrenadaGuatemalaGuineaGuinea-BissauGuyanaHeavily indebted poor countries (HIPC)High incomeHondurasHong Kong SAR, ChinaHungaryIBRD onlyIcelandIDA & IBRD totalIDA blendIDA onlyIDA totalIndiaIndonesiaIran, Islamic Rep.IraqIrelandIsraelItalyJamaicaJapanJordanKazakhstanKenyaKiribatiKorea, Dem. People’s Rep.Korea, Rep.KuwaitKyrgyz RepublicLao PDRLate-demographic dividendLatin America & Caribbean Latin America & Caribbean (excluding high income)Latin America & the Caribbean (IDA & IBRD countries)LatviaLeast developed countries: UN classificationLebanonLesothoLiberiaLibyaLiechtensteinLithuaniaLow & middle incomeLow incomeLower middle incomeLuxembourgMacao SAR, ChinaMacedonia, FYRMadagascarMalawiMaldivesMaliMaltaMarshall IslandsMauritaniaMauritiusMexicoMicronesia, Fed. Sts.Middle East & North AfricaMiddle East & North Africa (excluding high income)Middle East & North Africa (IDA & IBRD countries)Middle incomeMoldovaMongoliaMontenegroMoroccoMozambiqueMyanmarNamibiaNauruNepalNetherlandsNew ZealandNicaraguaNigerNigeriaNorth AmericaNorwayOECD membersOmanOther small statesPacific island small statesPakistanPalauPanamaPapua New GuineaParaguayPeruPhilippinesPolandPortugalPost-demographic dividendPre-demographic dividendPuerto RicoQatarRomaniaRussian FederationRwandaSamoaSan MarinoSao Tome and PrincipeSaudi ArabiaSenegalSerbiaSeychellesSierra LeoneSlovak RepublicSloveniaSmall statesSolomon IslandsSomaliaSouth AfricaSouth AsiaSouth Asia (IDA & IBRD)SpainSri LankaSt. Kitts and NevisSt. LuciaSt. Vincent and the GrenadinesSub-Saharan Africa Sub-Saharan Africa (excluding high income)Sub-Saharan Africa (IDA & IBRD countries)SudanSurinameSwazilandSwedenSwitzerlandSyrian Arab RepublicTajikistanTanzaniaThailandTimor-LesteTogoTongaTrinidad and TobagoTunisiaTurkeyTurkmenistanTuvaluUgandaUkraineUnited Arab EmiratesUnited KingdomUnited StatesUpper middle incomeUruguayUzbekistanVanuatuVenezuela, RBVietnamWest Bank and GazaWorldYemen, Rep.ZambiaZimbabwe Timeline:
This timeline shows a graph from 1971 to 2014 of Botswana. No data until 1970. Number of actual observations by date: 37.
Source name:
World Development Indicators
Source organization:
United Nations Educational, Scientific, and Cultural Organization (UNESCO) Institute for Statistics.
Categories, topics:
Education, Gender
Last updated:
apr 23, 2017
Indicators value changes by year
Maximum:
81.633
jan 1, 2014
At the date of observation
Value
Absolute change
Change from previous value
jan 1, 1971
6.868
+6.868
0.0%
jan 1, 1972
7.705
+0.837
12.18%
jan 1, 1973
8.793
+1.088
14.12%
jan 1, 1974
11.763
+2.97
33.78%
jan 1, 1975
12.548
+0.784
6.67%
jan 1, 1976
14.019
+1.471
11.72%
jan 1, 1977
15.072
+1.054
7.52%
jan 1, 1978
15.692
+0.62
4.11%
jan 1, 1979
16.604
+0.912
5.81%
jan 1, 1980
16.249
-0.355
-2.14%
jan 1, 1981
16.795
+0.546
3.36%
jan 1, 1982
18.059
+1.264
7.53%
jan 1, 1984
18.974
+0.915
5.07%
jan 1, 1985
23.103
+4.13
21.77%
jan 1, 1986
26.337
+3.233
14.0%
jan 1, 1987
28.431
+2.094
7.95%
jan 1, 1988
30.424
+1.993
7.01%
jan 1, 1989
30.289
-0.136
-0.45%
jan 1, 1990
34.738
+4.45
14.69%
jan 1, 1991
37.673
+2.935
8.45%
jan 1, 1992
44.176
+6.503
17.26%
jan 1, 1993
43.977
-0.199
-0.45%
jan 1, 1994
48.126
+4.149
9.43%
jan 1, 1995
47.868
-0.258
-0.54%
jan 1, 1996
54.173
+6.305
13.17%
jan 1, 1999
69.595
+15.422
28.47%
jan 1, 2000
71.088
+1.492
2.14%
jan 1, 2001
72.819
+1.732
2.44%
jan 1, 2002
72.946
+0.126
0.17%
jan 1, 2003
73.521
+0.576
0.79%
jan 1, 2004
74.253
+0.732
1.0%
jan 1, 2005
76.115
+1.862
2.51%
jan 1, 2006
77.329
+1.215
1.6%
jan 1, 2007
78.367
+1.038
1.34%
jan 1, 2008
79.128
+0.76
0.97%
jan 1, 2013
80.449
+1.321
1.67%
jan 1, 2014
81.633
+1.185
1.47%
Ranking of countries by current statistics by years


Comments: