29
/
en
AIzaSyAYiBZKx7MnpbEhh9jyipgxe19OcubqV5w
April 1, 2024
50448
Middle East & North Africa (IDA & IBRD countries)
TMN
false
2
1
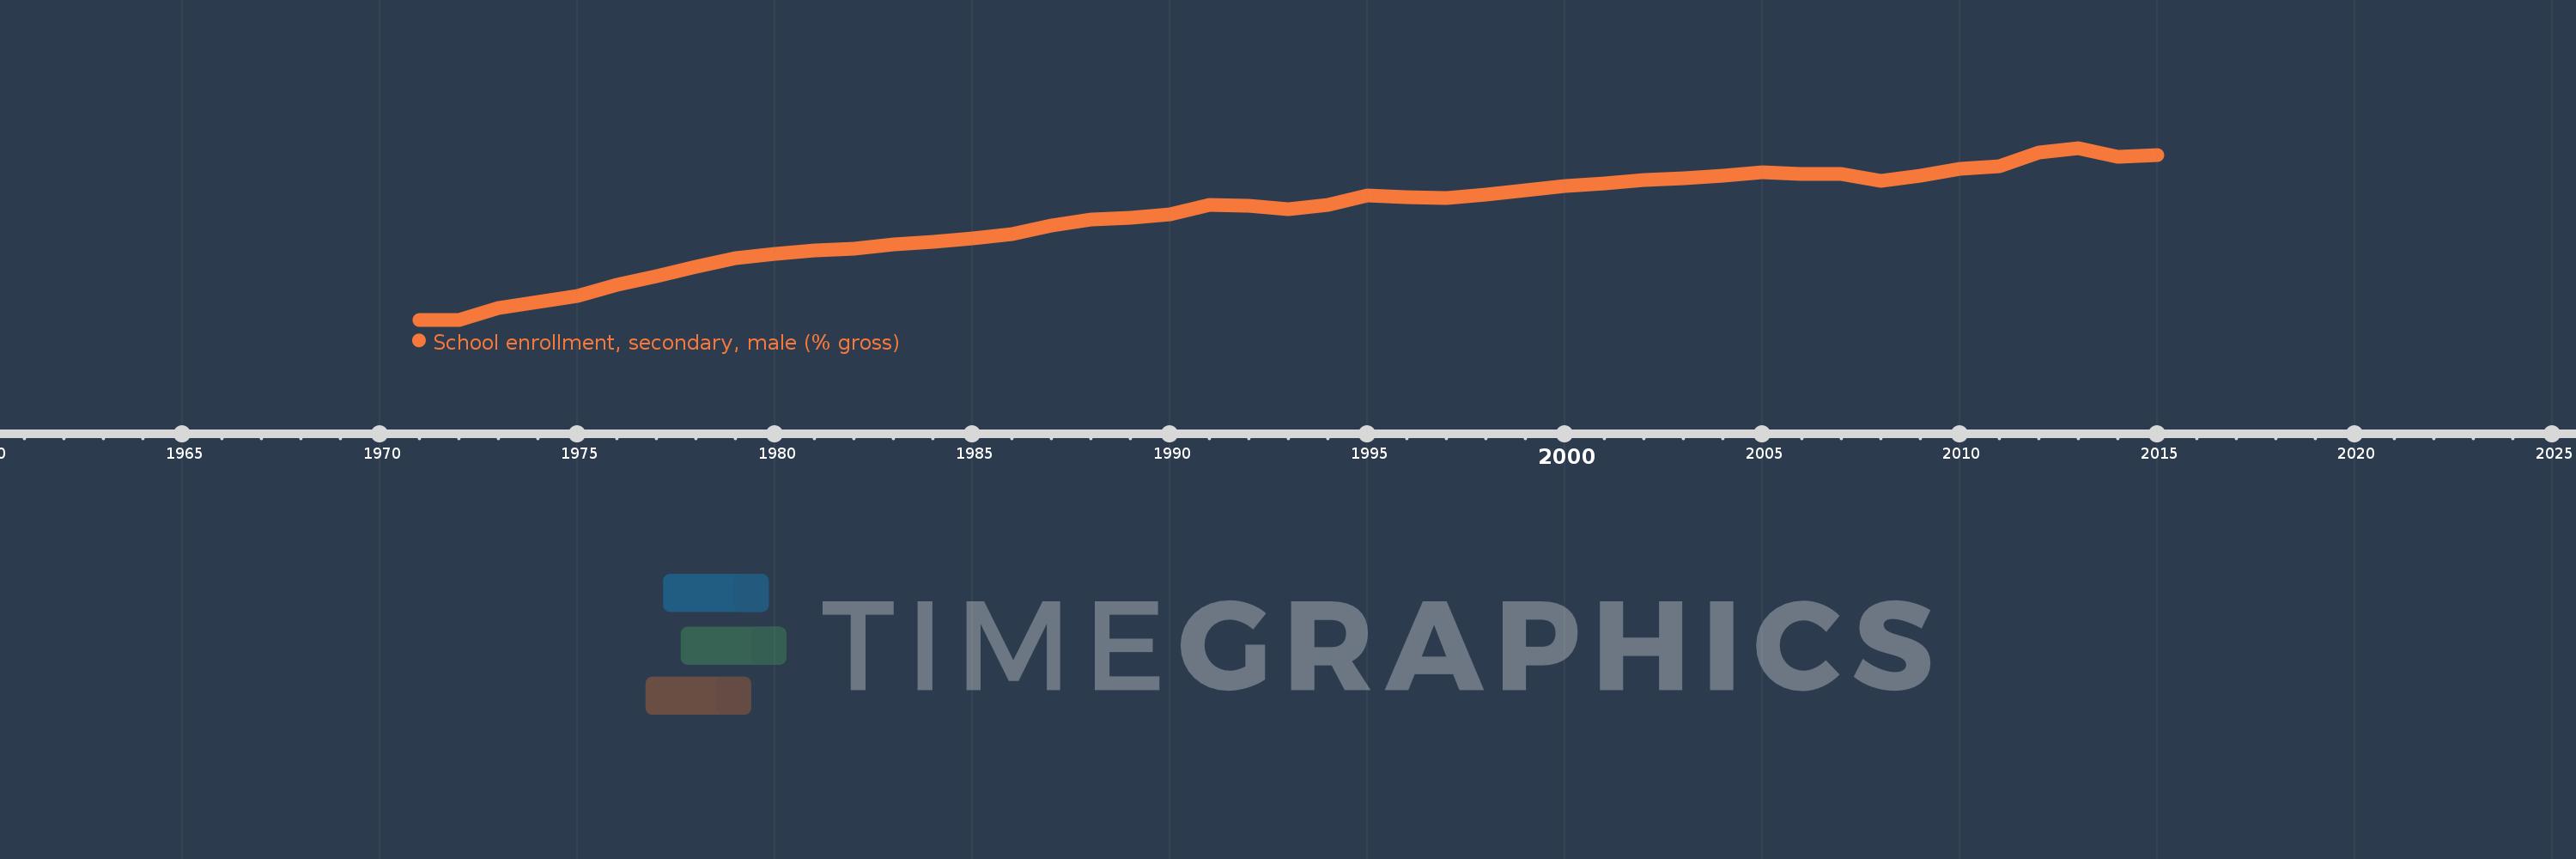
School enrollment, secondary, male (% gross)
2015,2014,2013,2012,2011,2010,2009,2008,2007,2006,2005,2004,2003,2002,2001,2000,1999,1998,1997,1996,1995,1994,1993,1992,1991,1990,1989,1988,1987,1986,1985,1984,1983,1982,1981,1980,1979,1978,1977,1976,1975,1974,1973,1972,1971
This statistics in other country:
AfghanistanAlbaniaAlgeriaAndorraAngolaAntigua and BarbudaArab WorldArgentinaArmeniaArubaAustraliaAustriaAzerbaijanBahamas, TheBahrainBangladeshBarbadosBelarusBelgiumBelizeBeninBermudaBhutanBoliviaBosnia and HerzegovinaBotswanaBrazilBrunei DarussalamBulgariaBurkina FasoBurundiCabo VerdeCambodiaCameroonCanadaCaribbean small statesCentral African RepublicCentral Europe and the BalticsChadChileChinaColombiaComorosCongo, Dem. Rep.Congo, Rep.Costa RicaCote d'IvoireCroatiaCubaCuracaoCyprusCzech RepublicDenmarkDjiboutiDominicaDominican RepublicEarly-demographic dividendEast Asia & PacificEast Asia & Pacific (excluding high income)East Asia & Pacific (IDA & IBRD countries)EcuadorEgypt, Arab Rep.El SalvadorEquatorial GuineaEritreaEstoniaEthiopiaEuro areaEurope & Central AsiaEurope & Central Asia (excluding high income)Europe & Central Asia (IDA & IBRD countries)European UnionFijiFinlandFragile and conflict affected situationsFranceGabonGambia, TheGeorgiaGermanyGhanaGreeceGrenadaGuatemalaGuineaGuinea-BissauGuyanaHeavily indebted poor countries (HIPC)High incomeHondurasHong Kong SAR, ChinaHungaryIBRD onlyIcelandIDA & IBRD totalIDA blendIDA onlyIDA totalIndiaIndonesiaIran, Islamic Rep.IraqIrelandIsraelItalyJamaicaJapanJordanKazakhstanKenyaKiribatiKorea, Dem. People’s Rep.Korea, Rep.KuwaitKyrgyz RepublicLao PDRLate-demographic dividendLatin America & Caribbean Latin America & Caribbean (excluding high income)Latin America & the Caribbean (IDA & IBRD countries)LatviaLeast developed countries: UN classificationLebanonLesothoLiberiaLibyaLiechtensteinLithuaniaLow & middle incomeLow incomeLower middle incomeLuxembourgMacao SAR, ChinaMacedonia, FYRMadagascarMalawiMaldivesMaliMaltaMarshall IslandsMauritaniaMauritiusMexicoMicronesia, Fed. Sts.Middle East & North AfricaMiddle East & North Africa (excluding high income)Middle East & North Africa (IDA & IBRD countries)Middle incomeMoldovaMongoliaMontenegroMoroccoMozambiqueMyanmarNamibiaNauruNepalNetherlandsNew ZealandNicaraguaNigerNigeriaNorth AmericaNorwayOECD membersOmanOther small statesPacific island small statesPakistanPalauPanamaPapua New GuineaParaguayPeruPhilippinesPolandPortugalPost-demographic dividendPre-demographic dividendPuerto RicoQatarRomaniaRussian FederationRwandaSamoaSan MarinoSao Tome and PrincipeSaudi ArabiaSenegalSerbiaSeychellesSierra LeoneSlovak RepublicSloveniaSmall statesSolomon IslandsSomaliaSouth AfricaSouth AsiaSouth Asia (IDA & IBRD)SpainSri LankaSt. Kitts and NevisSt. LuciaSt. Vincent and the GrenadinesSub-Saharan Africa Sub-Saharan Africa (excluding high income)Sub-Saharan Africa (IDA & IBRD countries)SudanSurinameSwazilandSwedenSwitzerlandSyrian Arab RepublicTajikistanTanzaniaThailandTimor-LesteTogoTongaTrinidad and TobagoTunisiaTurkeyTurkmenistanTuvaluUgandaUkraineUnited Arab EmiratesUnited KingdomUnited StatesUpper middle incomeUruguayUzbekistanVanuatuVenezuela, RBVietnamWest Bank and GazaWorldYemen, Rep.ZambiaZimbabwe Timeline:
This timeline shows a graph from 1971 to 2015 of Middle East & North Africa (IDA & IBRD countries). No data until 1970. Number of actual observations by date: 45.
Source name:
World Development Indicators
Source organization:
United Nations Educational, Scientific, and Cultural Organization (UNESCO) Institute for Statistics.
Categories, topics:
Education, Gender
Last updated:
apr 23, 2017
Indicators value changes by year
Minimum:
33.016
jan 1, 1972
Maximum:
80.008
jan 1, 2013
At the date of observation
Value
Absolute change
Change from previous value
jan 1, 1971
33.055
+33.055
0.0%
jan 1, 1972
33.016
-0.039
-0.12%
jan 1, 1973
36.263
+3.247
9.83%
jan 1, 1974
37.873
+1.61
4.44%
jan 1, 1975
39.568
+1.695
4.48%
jan 1, 1976
42.487
+2.918
7.38%
jan 1, 1977
45.004
+2.517
5.92%
jan 1, 1978
47.552
+2.548
5.66%
jan 1, 1979
49.825
+2.273
4.78%
jan 1, 1980
51.103
+1.278
2.56%
jan 1, 1981
52.006
+0.904
1.77%
jan 1, 1982
52.385
+0.379
0.73%
jan 1, 1983
53.641
+1.255
2.4%
jan 1, 1984
54.302
+0.661
1.23%
jan 1, 1985
55.272
+0.97
1.79%
jan 1, 1986
56.419
+1.147
2.08%
jan 1, 1987
58.754
+2.335
4.14%
jan 1, 1988
60.324
+1.57
2.67%
jan 1, 1989
60.879
+0.555
0.92%
jan 1, 1990
61.857
+0.978
1.61%
jan 1, 1991
64.484
+2.627
4.25%
jan 1, 1992
64.101
-0.383
-0.59%
jan 1, 1993
63.147
-0.954
-1.49%
jan 1, 1994
64.376
+1.228
1.95%
jan 1, 1995
67.118
+2.742
4.26%
jan 1, 1996
66.585
-0.534
-0.8%
jan 1, 1997
66.272
-0.313
-0.47%
jan 1, 1998
67.308
+1.036
1.56%
jan 1, 1999
68.456
+1.148
1.71%
jan 1, 2000
69.566
+1.111
1.62%
jan 1, 2001
70.382
+0.816
1.17%
jan 1, 2002
71.165
+0.782
1.11%
jan 1, 2003
71.756
+0.591
0.83%
jan 1, 2004
72.474
+0.718
1.0%
jan 1, 2005
73.36
+0.886
1.22%
jan 1, 2006
72.822
-0.538
-0.73%
jan 1, 2007
72.849
+0.027
0.04%
jan 1, 2008
71.095
-1.754
-2.41%
jan 1, 2009
72.477
+1.382
1.94%
jan 1, 2010
74.203
+1.726
2.38%
jan 1, 2011
75.027
+0.824
1.11%
jan 1, 2012
78.737
+3.71
4.94%
jan 1, 2013
80.008
+1.271
1.61%
jan 1, 2014
77.521
-2.488
-3.11%
jan 1, 2015
78.173
+0.653
0.84%
Ranking of countries by current statistics by years


Comments: