29
/
en
AIzaSyAYiBZKx7MnpbEhh9jyipgxe19OcubqV5w
April 1, 2024
65770
Algeria
DZA
true
2
1
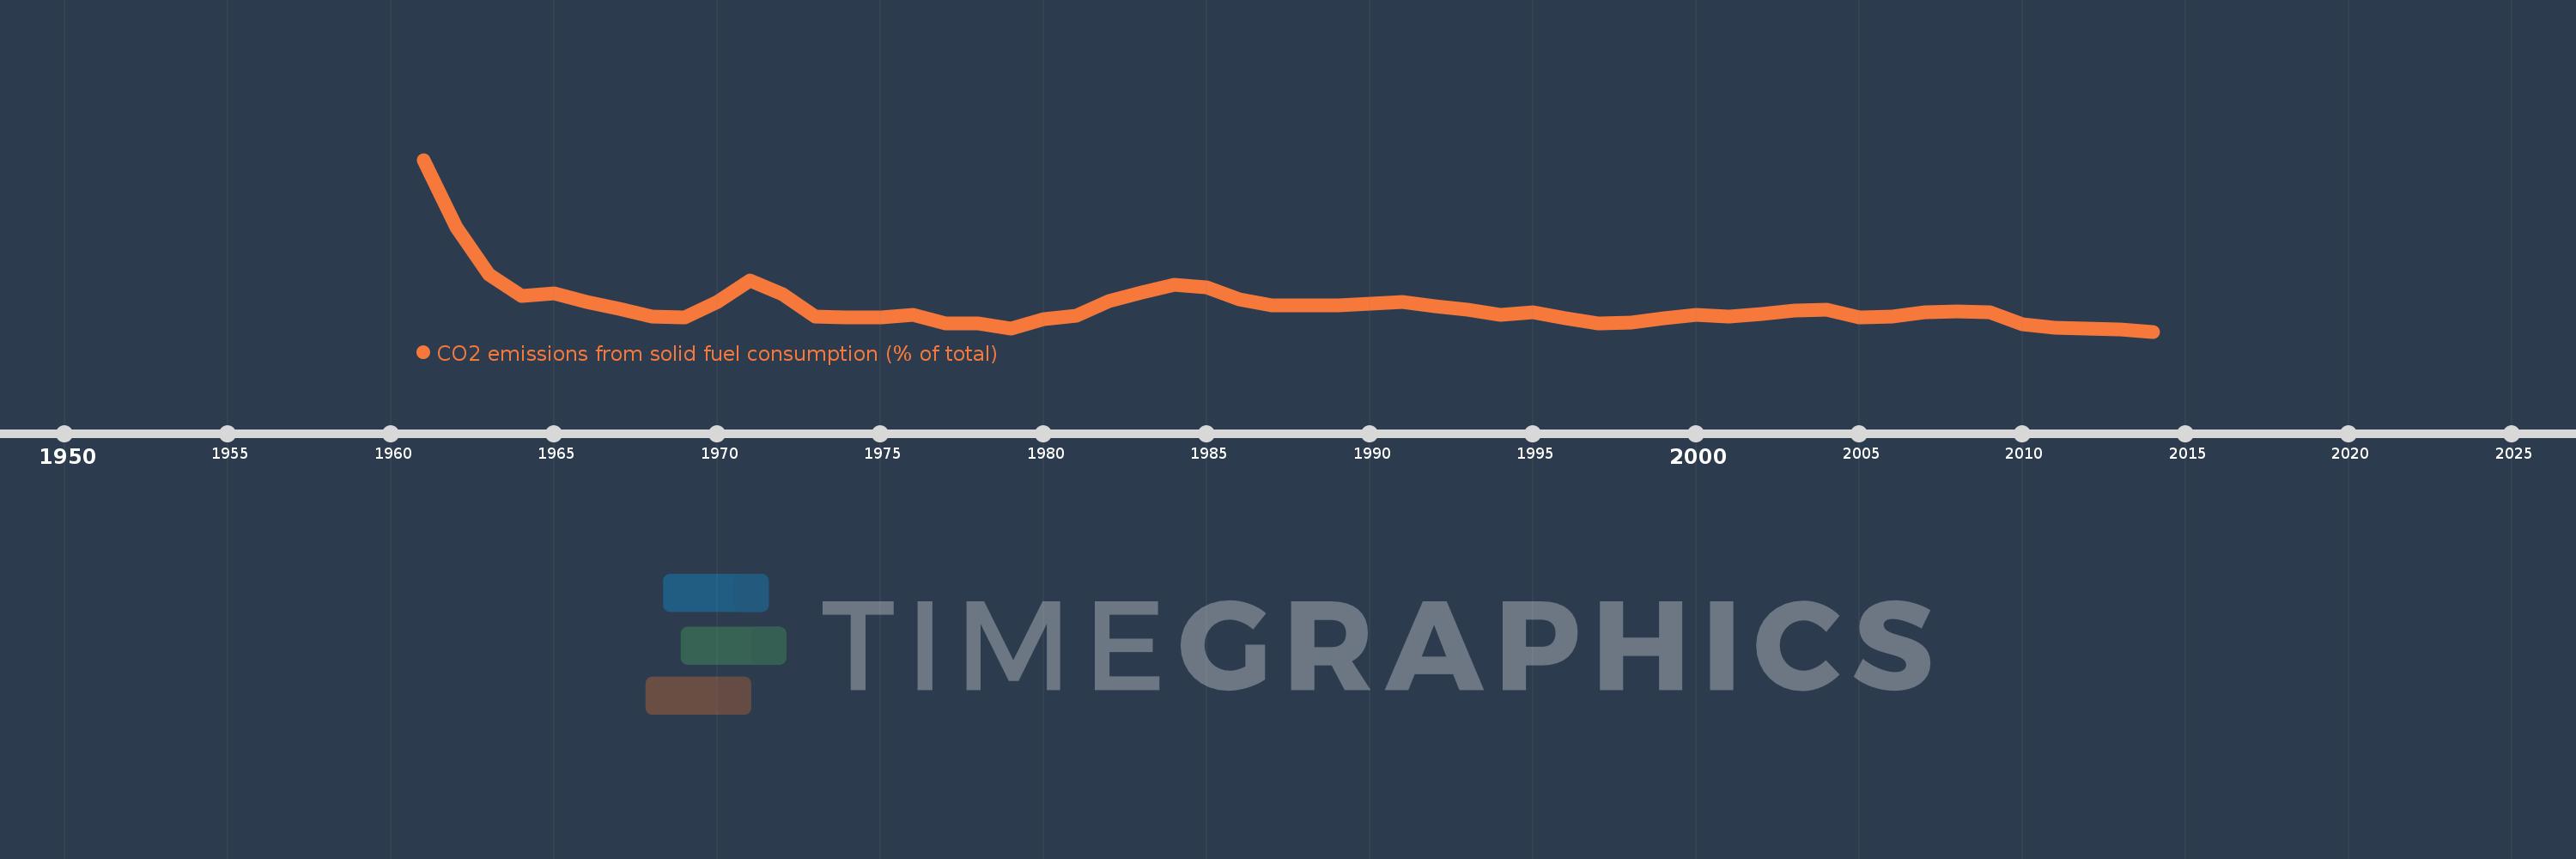
CO2 emissions from solid fuel consumption (% of total)
2014,2013,2012,2011,2010,2009,2008,2007,2006,2005,2004,2003,2002,2001,2000,1999,1998,1997,1996,1995,1994,1993,1992,1991,1990,1989,1988,1987,1986,1985,1984,1983,1982,1981,1980,1979,1978,1977,1976,1975,1974,1973,1972,1971,1970,1969,1968,1967,1966,1965,1964,1963,1962,1961
This statistics in other country:
AfghanistanAlbaniaAlgeriaAndorraAngolaAntigua and BarbudaArab WorldArgentinaArmeniaArubaAustraliaAustriaAzerbaijanBahamas, TheBahrainBangladeshBarbadosBelarusBelgiumBelizeBeninBermudaBhutanBoliviaBosnia and HerzegovinaBotswanaBrazilBritish Virgin IslandsBrunei DarussalamBulgariaBurkina FasoBurundiCabo VerdeCambodiaCameroonCanadaCaribbean small statesCayman IslandsCentral African RepublicCentral Europe and the BalticsChadChileChinaColombiaComorosCongo, Dem. Rep.Congo, Rep.Costa RicaCote d'IvoireCroatiaCubaCuracaoCyprusCzech RepublicDenmarkDjiboutiDominicaDominican RepublicEarly-demographic dividendEast Asia & PacificEast Asia & Pacific (excluding high income)East Asia & Pacific (IDA & IBRD countries)EcuadorEgypt, Arab Rep.El SalvadorEquatorial GuineaEritreaEstoniaEthiopiaEuro areaEurope & Central AsiaEurope & Central Asia (excluding high income)Europe & Central Asia (IDA & IBRD countries)European UnionFaroe IslandsFijiFinlandFragile and conflict affected situationsFranceFrench PolynesiaGabonGambia, TheGeorgiaGermanyGhanaGibraltarGreeceGreenlandGrenadaGuatemalaGuineaGuinea-BissauGuyanaHaitiHeavily indebted poor countries (HIPC)High incomeHondurasHong Kong SAR, ChinaHungaryIBRD onlyIcelandIDA & IBRD totalIDA blendIDA onlyIDA totalIndiaIndonesiaIran, Islamic Rep.IraqIrelandIsraelItalyJamaicaJapanJordanKazakhstanKenyaKiribatiKorea, Dem. People’s Rep.Korea, Rep.KuwaitKyrgyz RepublicLao PDRLate-demographic dividendLatin America & Caribbean Latin America & Caribbean (excluding high income)Latin America & the Caribbean (IDA & IBRD countries)LatviaLeast developed countries: UN classificationLebanonLesothoLiberiaLibyaLiechtensteinLithuaniaLow & middle incomeLow incomeLower middle incomeLuxembourgMacao SAR, ChinaMacedonia, FYRMadagascarMalawiMalaysiaMaldivesMaliMaltaMarshall IslandsMauritaniaMauritiusMexicoMicronesia, Fed. Sts.Middle East & North AfricaMiddle East & North Africa (excluding high income)Middle East & North Africa (IDA & IBRD countries)Middle incomeMoldovaMongoliaMontenegroMoroccoMozambiqueMyanmarNamibiaNauruNepalNetherlandsNew CaledoniaNew ZealandNicaraguaNigerNigeriaNorth AmericaNorwayOECD membersOmanOther small statesPacific island small statesPakistanPalauPanamaPapua New GuineaParaguayPeruPhilippinesPolandPortugalPost-demographic dividendPre-demographic dividendQatarRomaniaRussian FederationRwandaSamoaSao Tome and PrincipeSaudi ArabiaSenegalSerbiaSeychellesSierra LeoneSingaporeSint Maarten (Dutch part)Slovak RepublicSloveniaSmall statesSolomon IslandsSomaliaSouth AfricaSouth AsiaSouth Asia (IDA & IBRD)South SudanSpainSri LankaSt. Kitts and NevisSt. LuciaSt. Vincent and the GrenadinesSub-Saharan Africa Sub-Saharan Africa (excluding high income)Sub-Saharan Africa (IDA & IBRD countries)SudanSurinameSwazilandSwedenSwitzerlandSyrian Arab RepublicTajikistanTanzaniaThailandTimor-LesteTogoTongaTrinidad and TobagoTunisiaTurkeyTurkmenistanTurks and Caicos IslandsUgandaUkraineUnited Arab EmiratesUnited KingdomUnited StatesUpper middle incomeUruguayUzbekistanVanuatuVenezuela, RBVietnamWest Bank and GazaWorldYemen, Rep.ZambiaZimbabwe Timeline:
This timeline shows a graph from 1961 to 2014 of Algeria. No data until 1960. Number of actual observations by date: 54.
Source name:
World Development Indicators
Source organization:
Carbon Dioxide Information Analysis Center, Environmental Sciences Division, Oak Ridge National Laboratory, Tennessee, United States.
Categories, topics:
Climate Change, Environment
Last updated:
apr 23, 2017
Indicators value changes by year
Maximum:
20.417
jan 1, 1961
At the date of observation
Value
Absolute change
Change from previous value
jan 1, 1961
20.417
+20.417
0.0%
jan 1, 1962
12.636
-7.781
-38.11%
jan 1, 1963
7.18
-5.456
-43.18%
jan 1, 1964
4.662
-2.518
-35.07%
jan 1, 1965
4.997
+0.335
7.18%
jan 1, 1966
4.002
-0.995
-19.9%
jan 1, 1967
3.219
-0.783
-19.57%
jan 1, 1968
2.259
-0.96
-29.82%
jan 1, 1969
2.226
-0.033
-1.46%
jan 1, 1970
4.0
+1.774
79.71%
jan 1, 1971
6.446
+2.446
61.15%
jan 1, 1972
4.832
-1.614
-25.04%
jan 1, 1973
2.289
-2.543
-52.62%
jan 1, 1974
2.144
-0.146
-6.36%
jan 1, 1975
2.195
+0.051
2.39%
jan 1, 1976
2.473
+0.278
12.65%
jan 1, 1977
1.498
-0.975
-39.43%
jan 1, 1978
1.444
-0.054
-3.57%
jan 1, 1979
0.915
-0.529
-36.66%
jan 1, 1980
1.961
+1.046
114.38%
jan 1, 1981
2.42
+0.459
23.39%
jan 1, 1982
4.114
+1.694
70.0%
jan 1, 1983
5.033
+0.919
22.34%
jan 1, 1984
5.986
+0.952
18.92%
jan 1, 1985
5.668
-0.318
-5.31%
jan 1, 1986
4.232
-1.436
-25.33%
jan 1, 1987
3.577
-0.655
-15.48%
jan 1, 1988
3.531
-0.046
-1.28%
jan 1, 1989
3.547
+0.016
0.45%
jan 1, 1990
3.734
+0.187
5.26%
jan 1, 1991
3.924
+0.19
5.09%
jan 1, 1992
3.498
-0.426
-10.85%
jan 1, 1993
3.074
-0.425
-12.14%
jan 1, 1994
2.442
-0.632
-20.55%
jan 1, 1995
2.739
+0.297
12.15%
jan 1, 1996
2.085
-0.654
-23.88%
jan 1, 1997
1.484
-0.601
-28.82%
jan 1, 1998
1.63
+0.146
9.85%
jan 1, 1999
2.048
+0.418
25.65%
jan 1, 2000
2.44
+0.392
19.16%
jan 1, 2001
2.319
-0.121
-4.98%
jan 1, 2002
2.575
+0.257
11.07%
jan 1, 2003
2.983
+0.407
15.82%
jan 1, 2004
3.119
+0.136
4.56%
jan 1, 2005
2.221
-0.898
-28.79%
jan 1, 2006
2.28
+0.059
2.65%
jan 1, 2007
2.766
+0.486
21.32%
jan 1, 2008
2.837
+0.071
2.56%
jan 1, 2009
2.816
-0.021
-0.73%
jan 1, 2010
1.341
-1.475
-52.39%
jan 1, 2011
1.022
-0.319
-23.81%
jan 1, 2012
0.865
-0.156
-15.28%
jan 1, 2013
0.798
-0.067
-7.75%
jan 1, 2014
0.541
-0.257
-32.24%
Ranking of countries by current statistics by years


Comments: