29
/
en
AIzaSyAYiBZKx7MnpbEhh9jyipgxe19OcubqV5w
April 1, 2024
193984
Mauritius
MUS
true
2
1
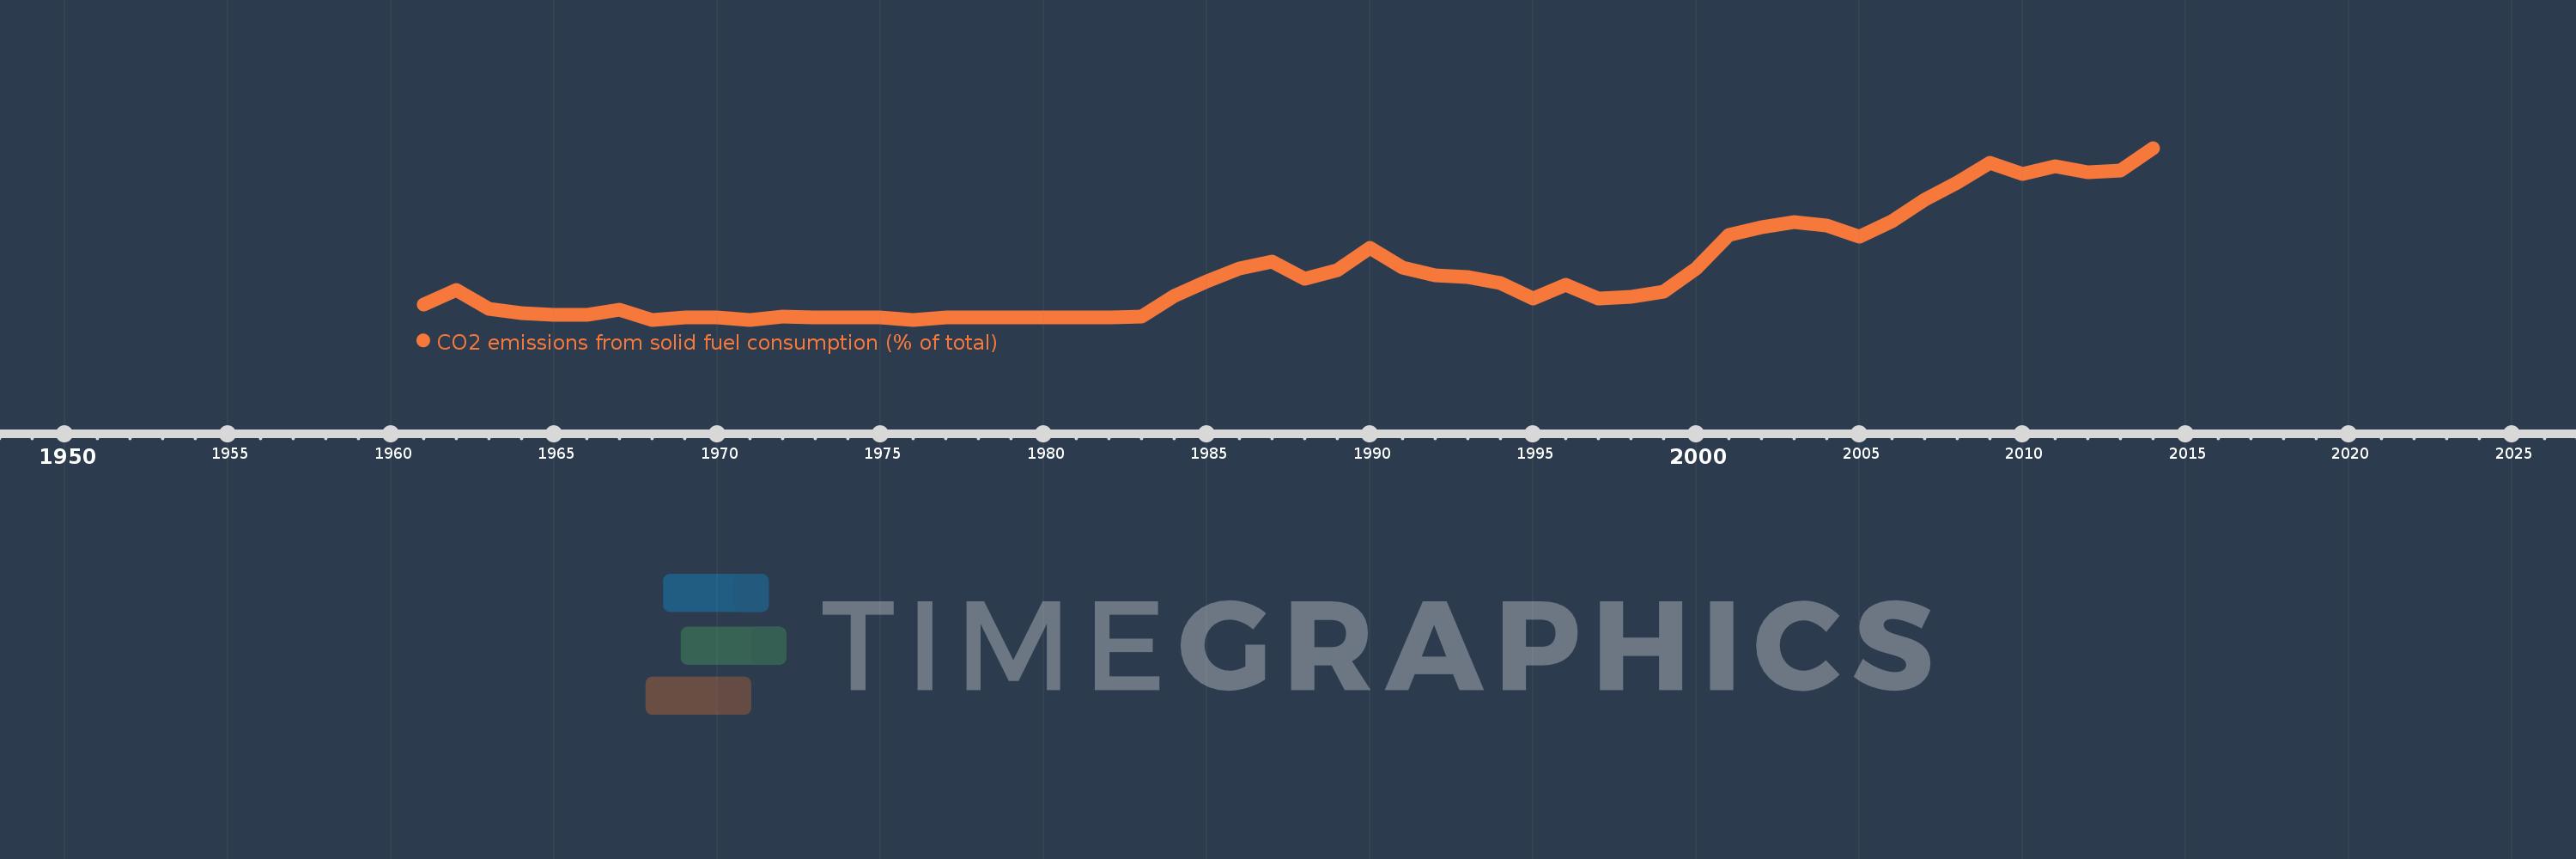
CO2 emissions from solid fuel consumption (% of total)
2014,2013,2012,2011,2010,2009,2008,2007,2006,2005,2004,2003,2002,2001,2000,1999,1998,1997,1996,1995,1994,1993,1992,1991,1990,1989,1988,1987,1986,1985,1984,1983,1982,1981,1980,1979,1978,1977,1976,1975,1974,1973,1972,1971,1970,1969,1968,1967,1966,1965,1964,1963,1962,1961
This statistics in other country:
AfghanistanAlbaniaAlgeriaAndorraAngolaAntigua and BarbudaArab WorldArgentinaArmeniaArubaAustraliaAustriaAzerbaijanBahamas, TheBahrainBangladeshBarbadosBelarusBelgiumBelizeBeninBermudaBhutanBoliviaBosnia and HerzegovinaBotswanaBrazilBritish Virgin IslandsBrunei DarussalamBulgariaBurkina FasoBurundiCabo VerdeCambodiaCameroonCanadaCaribbean small statesCayman IslandsCentral African RepublicCentral Europe and the BalticsChadChileChinaColombiaComorosCongo, Dem. Rep.Congo, Rep.Costa RicaCote d'IvoireCroatiaCubaCuracaoCyprusCzech RepublicDenmarkDjiboutiDominicaDominican RepublicEarly-demographic dividendEast Asia & PacificEast Asia & Pacific (excluding high income)East Asia & Pacific (IDA & IBRD countries)EcuadorEgypt, Arab Rep.El SalvadorEquatorial GuineaEritreaEstoniaEthiopiaEuro areaEurope & Central AsiaEurope & Central Asia (excluding high income)Europe & Central Asia (IDA & IBRD countries)European UnionFaroe IslandsFijiFinlandFragile and conflict affected situationsFranceFrench PolynesiaGabonGambia, TheGeorgiaGermanyGhanaGibraltarGreeceGreenlandGrenadaGuatemalaGuineaGuinea-BissauGuyanaHaitiHeavily indebted poor countries (HIPC)High incomeHondurasHong Kong SAR, ChinaHungaryIBRD onlyIcelandIDA & IBRD totalIDA blendIDA onlyIDA totalIndiaIndonesiaIran, Islamic Rep.IraqIrelandIsraelItalyJamaicaJapanJordanKazakhstanKenyaKiribatiKorea, Dem. People’s Rep.Korea, Rep.KuwaitKyrgyz RepublicLao PDRLate-demographic dividendLatin America & Caribbean Latin America & Caribbean (excluding high income)Latin America & the Caribbean (IDA & IBRD countries)LatviaLeast developed countries: UN classificationLebanonLesothoLiberiaLibyaLiechtensteinLithuaniaLow & middle incomeLow incomeLower middle incomeLuxembourgMacao SAR, ChinaMacedonia, FYRMadagascarMalawiMalaysiaMaldivesMaliMaltaMarshall IslandsMauritaniaMauritiusMexicoMicronesia, Fed. Sts.Middle East & North AfricaMiddle East & North Africa (excluding high income)Middle East & North Africa (IDA & IBRD countries)Middle incomeMoldovaMongoliaMontenegroMoroccoMozambiqueMyanmarNamibiaNauruNepalNetherlandsNew CaledoniaNew ZealandNicaraguaNigerNigeriaNorth AmericaNorwayOECD membersOmanOther small statesPacific island small statesPakistanPalauPanamaPapua New GuineaParaguayPeruPhilippinesPolandPortugalPost-demographic dividendPre-demographic dividendQatarRomaniaRussian FederationRwandaSamoaSao Tome and PrincipeSaudi ArabiaSenegalSerbiaSeychellesSierra LeoneSingaporeSint Maarten (Dutch part)Slovak RepublicSloveniaSmall statesSolomon IslandsSomaliaSouth AfricaSouth AsiaSouth Asia (IDA & IBRD)South SudanSpainSri LankaSt. Kitts and NevisSt. LuciaSt. Vincent and the GrenadinesSub-Saharan Africa Sub-Saharan Africa (excluding high income)Sub-Saharan Africa (IDA & IBRD countries)SudanSurinameSwazilandSwedenSwitzerlandSyrian Arab RepublicTajikistanTanzaniaThailandTimor-LesteTogoTongaTrinidad and TobagoTunisiaTurkeyTurkmenistanTurks and Caicos IslandsUgandaUkraineUnited Arab EmiratesUnited KingdomUnited StatesUpper middle incomeUruguayUzbekistanVanuatuVenezuela, RBVietnamWest Bank and GazaWorldYemen, Rep.ZambiaZimbabwe Timeline:
This timeline shows a graph from 1961 to 2014 of Mauritius. No data until 1960. Number of actual observations by date: 54.
Source name:
World Development Indicators
Source organization:
Carbon Dioxide Information Analysis Center, Environmental Sciences Division, Oak Ridge National Laboratory, Tennessee, United States.
Categories, topics:
Climate Change, Environment
Last updated:
apr 23, 2017
Indicators value changes by year
Maximum:
44.882
jan 1, 2014
At the date of observation
Value
Absolute change
Change from previous value
jan 1, 1961
4.082
+4.082
0.0%
jan 1, 1962
7.843
+3.762
92.16%
jan 1, 1963
2.899
-4.945
-63.04%
jan 1, 1964
1.754
-1.144
-39.47%
jan 1, 1965
1.19
-0.564
-32.14%
jan 1, 1966
1.205
+0.014
1.2%
jan 1, 1967
2.667
+1.462
121.33%
jan 1, 1968
0.0
-2.667
-100.0%
jan 1, 1969
0.575
+0.575
%
jan 1, 1970
0.641
+0.066
11.54%
jan 1, 1971
0.0
-0.641
-100.0%
jan 1, 1972
0.926
+0.926
%
jan 1, 1973
0.532
-0.394
-42.55%
jan 1, 1974
0.541
+0.009
1.62%
jan 1, 1975
0.529
-0.011
-2.12%
jan 1, 1976
0.0
-0.529
-100.0%
jan 1, 1977
0.592
+0.592
%
jan 1, 1978
0.571
-0.02
-3.43%
jan 1, 1979
0.581
+0.01
1.74%
jan 1, 1980
0.556
-0.026
-4.44%
jan 1, 1981
0.621
+0.066
11.8%
jan 1, 1982
0.676
+0.055
8.78%
jan 1, 1983
0.73
+0.054
8.03%
jan 1, 1984
6.135
+5.405
740.49%
jan 1, 1985
9.942
+3.807
62.05%
jan 1, 1986
13.472
+3.53
35.51%
jan 1, 1987
15.138
+1.666
12.37%
jan 1, 1988
10.63
-4.508
-29.78%
jan 1, 1989
12.876
+2.246
21.13%
jan 1, 1990
18.815
+5.94
46.13%
jan 1, 1991
13.534
-5.281
-28.07%
jan 1, 1992
11.566
-1.968
-14.54%
jan 1, 1993
11.159
-0.407
-3.52%
jan 1, 1994
9.504
-1.655
-14.83%
jan 1, 1995
5.643
-3.861
-40.62%
jan 1, 1996
9.218
+3.575
63.35%
jan 1, 1997
5.639
-3.579
-38.83%
jan 1, 1998
6.055
+0.416
7.38%
jan 1, 1999
7.432
+1.377
22.75%
jan 1, 2000
13.293
+5.861
78.85%
jan 1, 2001
22.071
+8.778
66.03%
jan 1, 2002
24.072
+2.001
9.07%
jan 1, 2003
25.54
+1.468
6.1%
jan 1, 2004
24.551
-0.989
-3.87%
jan 1, 2005
21.59
-2.961
-12.06%
jan 1, 2006
25.806
+4.217
19.53%
jan 1, 2007
31.313
+5.507
21.34%
jan 1, 2008
35.885
+4.572
14.6%
jan 1, 2009
40.953
+5.069
14.12%
jan 1, 2010
38.194
-2.759
-6.74%
jan 1, 2011
40.169
+1.974
5.17%
jan 1, 2012
38.447
-1.721
-4.29%
jan 1, 2013
39.009
+0.562
1.46%
jan 1, 2014
44.882
+5.873
15.06%
Ranking of countries by current statistics by years


Comments: